Chapter 28. Automatic Bug Reporting Tool (ABRT)
The Automatic Bug Reporting Tool , commonly abbreviated as ABRT , consists of the abrtd daemon and a number of system services and utilities to process, analyze, and report detected problems. The daemon runs silently in the background most of the time, and springs into action when an application crashes or a kernel oops is detected. The daemon then collects the relevant problem data such as a core file if there is one, the crashing application’s command-line parameters, and other data of forensic utility. For a brief overview of the most important ABRT components, see Table 28.1, “Basic ABRT components”.
For Red Hat Enterprise Linux 6.2, the Automatic Bug Reporting Tool has been upgraded to version 2.0. The ABRT 2-series brings major improvements to automatic bug detection and reporting.
Table 28.1. Basic ABRT components
[a] The abrt-addon-vmcore package is provided by the Optional subscription channel. See Section 8.4.8, “Adding the Optional and Supplementary Repositories” for more information on Red Hat additional channels.
ABRT currently supports detection of crashes in applications written in the C/C++ and Python languages, as well as kernel oopses. With Red Hat Enterprise Linux 6.3, ABRT can also detect kernel panics if the additional abrt-addon-vmcore package is installed and the kdump crash dumping mechanism is enabled and configured on the system accordingly.
ABRT is capable of reporting problems to a remote issue tracker. Reporting can be configured to happen automatically whenever an issue is detected, or problem data can be stored locally, reviewed, reported, and deleted manually by a user. The reporting tools can send problem data to a Bugzilla database, a Red Hat Technical Support (RHTSupport) site, upload it using FTP / SCP , email it, or write it to a file.
The part of ABRT which handles already-existing problem data (as opposed to, for example, creation of new problem data) has been factored out into a separate project, libreport . The libreport library provides a generic mechanism for analyzing and reporting problems, and it is used by applications other than ABRT . However, ABRT and libreport operation and configuration is closely integrated. They are therefore discussed as one in this document.
Whenever a problem is detected, ABRT compares it with all existing problem data and determines whether that same problem has been recorded. If it has been, the existing problem data is updated and the most recent (duplicate) problem is not recorded again. If this problem is not recognized by ABRT , a problem data directory is created. A problem data directory typically consists of files such as: analyzer , architecture , coredump , cmdline , executable , kernel , os_release , reason , time and uid .
Other files, such as backtrace , can be created during analysis depending on which analyzer method is used and its configuration settings. Each of these files holds specific information about the system and the problem itself. For example, the kernel file records the version of the crashed kernel.
After the problem directory is created and problem data gathered, you can further process, analyze and report the problem using either the ABRT GUI, or the abrt-cli utility for the command line. For more information about these tools, see Section 28.2, “Using the Graphical User Interface” and Section 28.3, “Using the Command-Line Interface” respectively.
If you do not use ABRT to further analyze and report the detected problems but instead you report problems using a legacy problem reporting tool, report , note that you can no longer file new bugs. The report utility can now only be used to attach new content to the already existing bugs in the RHTSupport or Bugzilla database. Use the following command to do so:
report [-v] --target target --ticket ID file …where target is either strata for reporting to RHTSupport or bugzilla for reporting to Bugzilla. ID stands for number identifying an existing problem case in the respective database, and file is a file containing information to be added to the problem case.
If you want to report new problems and you do not want to use abrt-cli , you can now use the report-cli utility instead of report . Issue the following command to let report-cli to guide you through the problem reporting process:
report-cli -r dump_directory …where dump_directory is a problem data directory created by ABRT or some other application using libreport . For more information on report-cli , see man report-cli .
28.1. Installing ABRT and Starting its Services
As a prerequisite for its use, the abrtd daemon requires the abrt user to exist for file system operations in the /var/spool/abrt directory. When the abrt package is installed, it automatically creates the abrt user whose UID and GID is 173, if such user does not already exist. Otherwise, the abrt user can be created manually. In that case, any UID and GID can be chosen, because abrtd does not require a specific UID and GID.
As the first step in order to use ABRT , you should ensure that the abrt-desktop package is installed on your system by running the following command as the root user:
With abrt-desktop installed, you will be able to use ABRT only in its graphical interface. If you intend to use ABRT on the command line, install the abrt-cli package:
See Section 8.2.4, “Installing Packages” for more information on how to install packages with the Yum package manager.
Your next step should be to verify that abrtd is running. The daemon is typically configured to start up at boot time. You can use the following command as root to verify its current status:
~]# service abrtd status abrtd (pid 1535) is running. If the service command returns the abrt is stopped message, the daemon is not running. It can be started for the current session by entering this command:
~]# service abrtd start Starting abrt daemon: [ OK ] Similarly, you can follow the same steps to check and start up the abrt-ccpp service if you want ABRT to catch C/C++ crashes. To set ABRT to detect kernel oopses, use the same steps for the abrt-oops service. Note that this service cannot catch kernel oopses which cause the system to fail, to become unresponsive or to reboot immediately. To be able to detect such kernel oopses with ABRT , you need to install the abrt-vmcore service. If you require this functionality, see Section 28.4.5, “Configuring ABRT to Detect a Kernel Panic” for more information.
When installing ABRT packages, all respective ABRT services are automatically enabled for runlevels 3 and 5 . You can disable or enable any ABRT service for the desired runlevels using the chkconfig utility. See Section 12.2.3, “Using the chkconfig Utility” for more information.
Please note that installing ABRT packages overwrites the /proc/sys/kernel/core_pattern file which can contain a template used to name core dump files. The content of this file will be overwritten to:
|/usr/libexec/abrt-hook-ccpp %s %c %p %u %g %t e
Finally, if you run ABRT in a graphical desktop environment, you can verify that the ABRT notification applet is running:
~]$ ps -el | grep abrt-applet 0 S 500 2036 1824 0 80 0 - 61604 poll_s ? 00:00:00 abrt-applet If the ABRT notification applet is not running, you can start it manually in your current desktop session by running the abrt-applet program:
The applet can be configured to start automatically when your graphical desktop session starts. You can ensure that the ABRT notification applet is added to the list of programs and selected to run at system startup by selecting the System → Preferences → Startup Applications menu in the top panel.
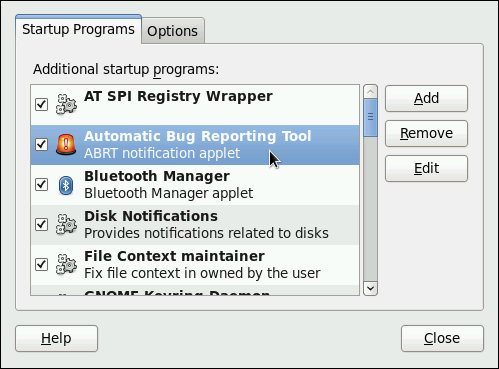
Figure 28.1. Setting ABRT notification applet to run automatically.
Шпаргалка 😉
abrtd — демон, который следит за крэшами программулин и в случае крэша делает core dump и сохраняет всякий другой полезный в отладке stuff. И — самое полезное — от может уведомлять нас сразу же о проблеме и даже аплоадить дебаг инфу на багзиллу или нужный ftp/scp сервер.
Постановка задачи — настроить в abrt отправку писем при обнаружении крэша кастомного софта на сервере.
Для начала установим необходимые пакеты.
yum install abrt-addon-ccpp abrt-addon-python abrt-cli abrt-plugin-logger abrt-plugin-mailx abrt-tui abrt
Если это для вас важно, то следует заметить, что установка abrt меняет kernel core_pattern:
cat /proc/sys/kernel/core_pattern
/usr/libexec/abrt-hook-ccpp %s %c %p %u %g %t e
Добавим в автозагрузку демона abrtd:
chkconfig abrtd on
chkconfig abrt-ccpp on
chkconfig abrt-oops on
- /etc/libreport/ — хранит конфиги связанные с репортами
- /etc/libreport/events.d/ — здесь лежат описания ивентов и реакции на них
- /etc/libreport/events/ — описание т. н. репортеров
- /etc/libreport/plugins/
- /etc/abrt/ — конфиги самого демона abrtd
- /etc/abrt/plugins/ — конфиги плугинов abrt.
/etc/abrt/abrt-action-save-package-data.conf — меняем значения:
OpenGPGCheck = no # говорим обрабатывать краши и не подписанных файлов
ProcessUnpackaged = yes # обрабатывать файлы, не принадлежащие пакетам rpm
/etc/libreport/events.d/abrt_event.conf здесь добавляем обработчики ивентов в конец файла:
EVENT=notify reporter-mailx
EVENT=notify_dup reporter-mailx
Subject=»[ABRT] crash in Example server detected»
EmailFrom=monitoring@example.com
EmailTo=admin@example.com,progger@example.com
В принципе, для работы этого достаточно. Но можно настроить на ивенты и заливку крэш-данных на свой фтп-сервер и на багзиллу.
Посмотреть отчет о произошедших проблемах можно командой:
А сами проблемы лежат в подпапках /var/spool/abrt/ccpp-*
Кстати, проблемы от одних и тех же источников abrt считает дубликатами и удаляет.
Fedora Developer Portal
Handle crashes of your applications automatically and debug with ease!
What is ABRT
ABRT (Automatic Bug Reporting Tool) is a set of tools to help users detect and report application crashes. It’s main purpose is to ease the process of reporting an issue and finding a solution.
ABRT can also be a valuable tool in developer’s toolbox, helping with collecting and debugging crashes in various programming languages.
Coupled with FAF (Fedora Analysis Framework) it provides extensive statistics about crashes of your application over its complete life cycle.
Using ABRT
ABRT is installed by default on most Fedora spins. You can verify its functionality by forcefully crashing an application of your choice. We choose sleep as our victim for demonstration purposes. Following commands will run sleep in background and then kill it with SIGSEGV signal to produce a crash:
When ABRT handles a crash you will get notified via desktop pop-up or console notification if abrt-desktop or abrt-console-notification package is installed. You can then investigate the crash via gnome-abrt GUI application or use abrt-cli when working from console.
It is always a good idea to test the ABRT functionality for applications you are developing or maintaining in Fedora. If you are building your own RPMs you might have to enable handling of non-GPG signed software. In case ABRT failed to handle crash of your application consult troubleshooting section of ABRT project documentation.
Reporting
If the crashing application is part of Fedora you can leverage reporting to Fedora hosted FAF instance and Red Hat Bugzilla. This is one of the advantages of having a package included in official Fedora repositories that allows developers and maintainers to receive bug reports from users of their application.
New ABRT CLI
Available since Fedora 23 is the new ABRT CLI tailored specifically for developers. It is part of a abrt-cli-ng package and can be installed with:
$ sudo dnf install abrt-cli-ng CLI is then available as abrt executable, try running it on your system:
By default it lists crashes that belong to currently logged-in user. To get detailed information about a last crash use info subcommand:
If bash-completion is installed on your system, the CLI can use it to complete hashes of problems or package names for its subcommands:
If the last parameter specifying problem to use is omitted subcommand will work with the last problem that occurred on the system.
To run GDB against a last problem use:
To install debuginfo packages for the affected package use
These two can be combined to automatically install debuginfo packages prior running gdb with:
$ abrt gdb --debuginfo-install To get the full list of commands and options use
Further reading
Refer to ABRT project documentation for more information and configuration examples.
Share your knowledge
Fedora Developer Portal is a community effort to share guides and information about open-source development. And we need your help!