- How to find uptime of a linux process
- How to Find Uptime of Particular Linux Process
- How to Find Uptime of Your Linux System
- 1. Check Linux Running Time Using Uptime Command
- 2. Check Linux Uptime Using W Command
- 3. Check Linux Uptime Using Top Command
- How to Display Running Processes in Linux
- 1. List Running Linux Processes Using top Command
- 2. Show Linux Processes Using ps Command
- 3. View Linux Processes Using htop and atop Commands
- How to Find Individual Process Uptime in Linux
- 1. Find Particular Process Uptime Using Ps Command
- 2. Find Specific Process Uptime Using Monit
How to find uptime of a linux process
As «uptime» has several meanings, here is a useful command.
ps -eo pid,comm,lstart,etime,time,args This command lists all processes with several different time-related columns. It has the following columns:
PID COMMAND STARTED ELAPSED TIME COMMAND PID = Process ID
first COMMAND = only the command name without options and without arguments
STARTED = the absolute time the process was started
ELAPSED = elapsed time since the process was started (wall clock time), format [[dd-]hh:]mm:ss TIME = cumulative CPU time, «[dd-]hh:mm:ss» format
second COMMAND = again the command, this time with all its provided options and arguments
If you have a limited version of ps such as is found in busybox , you can get the process start time by looking at the timestamp of /proc/ . For example, if the pid you want to look at is 55.
# ls -al /proc | grep 55 dr-xr-xr-x 7 root root 0 May 21 05:53 55 . and then compare it with the current date.
# date Thu May 22 03:00:47 EDT 2014 can generate the etimes= with proc entries like etime=$(date -d «$(stat -c %y /proc/$
1234 being the process id.
example with two processes started at the same hour minute seconds but not the same milliseconds:
$ stat /proc/9355 . Access: 2017-11-13 17:46:39.778791165 +0100 Modify: 2017-11-13 17:46:39.778791165 +0100 Change: 2017-11-13 17:46:39.778791165 +0100 $ stat /proc/9209 . Access: 2017-11-13 17:46:39.621790420 +0100 Modify: 2017-11-13 17:46:39.621790420 +0100 Change: 2017-11-13 17:46:39.621790420 +0100 yes, too old and yet too hard stuff. I tried with the above proposed «stat» method but what if I had «touch»-ed the PID proc dir yesterday? This means my year-old process is shown with yesterday’s time stamp. Nah, not what I need 🙁
In the newer ones, it’s simple:
ps -o etimes -p ELAPSED 339521 as simple as that. Time is present in seconds. Do whatever you need it for. With some older boxes, situation is harder, since there’s no etimes. One could rely on:
ps -o etime -p ELAPSED 76-03:26:15 which look a «a bit» weird since it’s in dd-hh:mm:ss format. Not suitable for further calculation. I would have preferred it in seconds, hence I used this one:
ps -o etime -p --no-headers | awk -F '(:)|(-)' 'BEGIN;=1;i--) s=s+a[i]*$i>END' 339544 do not parse the output of etime because busybox 1.29.3 changed the format. use the stat + /proc method instead
Such a simple thing is not properly answered after 5 years?
I don’t think you can accurately get milliseconds. eg. if you see man procfs and see /proc/$$/stat which has field 22 as startime, which is in «clock ticks», you would have something more precise, but clock ticks aren’t going at a perfectly constant rate (relative to ‘wall clock time’) and will be off. sleeping and certain things (ntpd I guess) offset it. For example on a machine running ntpd, with 8 days uptime and has never slept, dmesg -T has the same problem (I think. ), and you can see it here:
# date; echo h > /proc/sysrq-trigger; dmesg -T | tail -n1 ; date Fri Mar 3 10:26:17 CET 2017 [Fri Mar 3 10:26:16 2017] sysrq: SysRq : HELP : loglevel(0-9) reboot(b) crash(c) terminate-all-tasks(e) memory-full-oom-kill(f) kill-all-tasks(i) thaw-filesystems(j) sak(k) show-backtrace-all-active-cpus(l) show-memory-usage(m) nice-all-RT-tasks(n) poweroff(o) show-registers(p) show-all-timers(q) unraw(r) sync(s) show-task-states(t) unmount(u) force-fb(V) show-blocked-tasks(w) Fri Mar 3 10:26:17 CET 2017 # example pid here is just your shell pid=$$ # current unix time (seconds since epoch [1970-01-01 00:00:00 UTC]) now=$(date +%s) # process start unix time (also seconds since epoch) # I'm fairly sure this is the right way to get the start time in a machine readable way (unlike ps). but could be wrong start=$(stat -c %Y /proc/"$pid") # simple subtraction (both are in UTC, so it works) age=$((now-start)) printf "that process has run for %s seconds\n" "$age" How to Find Uptime of Particular Linux Process
Along with the system uptime, it’s also possible in the Linux operating system to check the uptime of a particular Linux process or service. Various Linux tools are available that can be used to quickly know how long an individual process has been running in Linux.
In this article, I’ll help you to know not just the various methods to find the uptime of a Linux system but also list all running processes and uptime of a particular Linux process, which you can apply on all Linux-based operating systems.
How to Find Uptime of Your Linux System
There are three most basic commands available that you can refer to check the time of your last system reboot: uptime, w, and top.
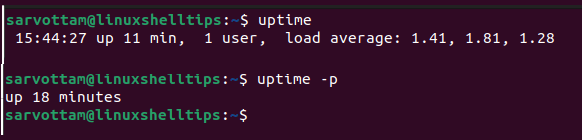
1. Check Linux Running Time Using Uptime Command
By just typing ‘uptime‘ in the terminal, it will display a result in one line.
Here, as you move from left to right, the line shows the current time, the number of hours and minutes your Linux system has been running, the number of current users logged in, and the load average of a system for the past 1, 5, and 15 minutes.
If you want results in another format with particular information, you can use various options available with the uptime command. For instance, using the -p option displays only the time up to which the Linux system is up and running.
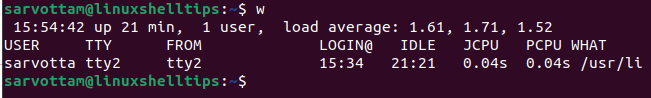
2. Check Linux Uptime Using W Command
Similar to uptime, the w command also displays the same uptime pieces of information along with users logged on and what they are doing.
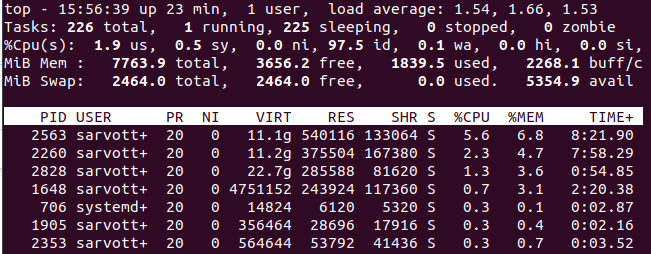
3. Check Linux Uptime Using Top Command
Being one of the most popular Linux tools for process management, the top command also shows how long you have been logged on to the system.
Furthermore, it goes beyond presenting a table containing a list of all running services on a system with their various information like CPU and memory usage.
How to Display Running Processes in Linux
If you don’t know there are no particular Linux tools that can directly give you the uptime of a particular service. You first need a command that can list currently running processes and combine that with another command (usually grep command) to identify the individual processes and their uptime.
That’s why before we head toward finding the uptime of a particular Linux service, let’s also see how we can list running processes in Linux using various methods.
1. List Running Linux Processes Using top Command
As you saw above, along with the uptime of the Linux system, the top command also displays the list of running processes in order of decreasing CPU usage by just executing:
Each column of the output in a tabular form lists particular information like the first column PID displays process IDs of services.
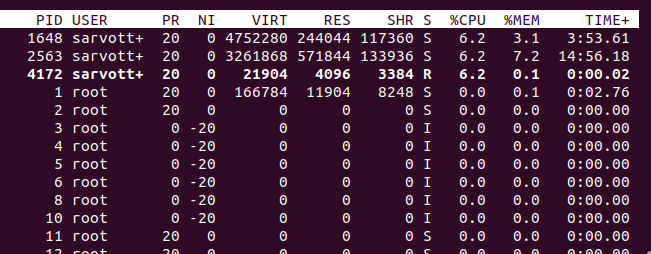
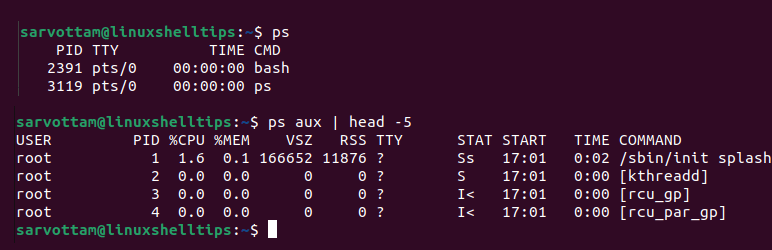
2. Show Linux Processes Using ps Command
The ps (processes status) command also lists currently active running processes. However, unlike the top, it presents only a snapshot of a process as a static list instead of real-time data.
Using various options along with the ps command will give detailed information. For instance, running the below command displays a list of all processes on the system with process ids, CPU, and memory usage.
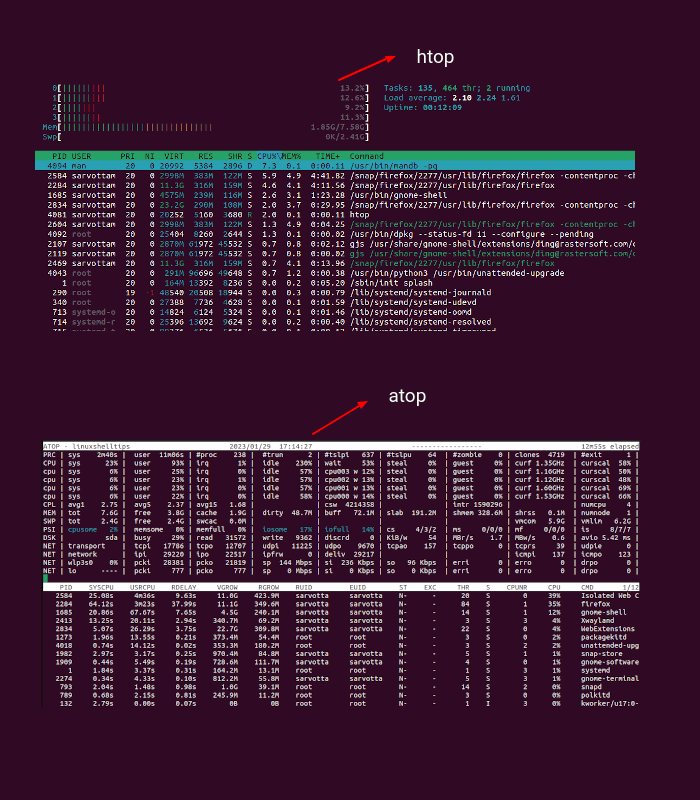
3. View Linux Processes Using htop and atop Commands
Apart from the pre-installed top and ps commands, you can also employ other tools like htop and atop that offers the same output but in an easy-to-understand and user-friendly way.
To install htop and atop on your Linux system, use the respective package managers as shown.
Install Htop in Linux
$ sudo apt install htop [On Debian, Ubuntu and Mint] $ sudo yum install htop [On RHEL/CentOS/Fedora and Rocky Linux/AlmaLinux] $ sudo emerge -a htop [On Gentoo Linux] $ sudo apk add htop [On Alpine Linux] $ sudo pacman -S htop [On Arch Linux] $ sudo zypper install htop [On OpenSUSE]
Install atop in Linux
$ sudo apt install atop [On Debian, Ubuntu and Mint] $ sudo yum install atop [On RHEL/CentOS/Fedora and Rocky Linux/AlmaLinux] $ sudo emerge -a atop [On Gentoo Linux] $ sudo apk add atop [On Alpine Linux] $ sudo pacman -S atop [On Arch Linux] $ sudo zypper install atop [On OpenSUSE]
Now, just type the htop or atop commands and you’ll see a piece of real-time detailed information.
If you want to explore more about the commands, check out its man pages by running the command:
How to Find Individual Process Uptime in Linux
Till now, you learned how to get system uptime and a list of all currently running processes. It’s time to get the uptime of a particular running process.
1. Find Particular Process Uptime Using Ps Command
As you saw above, ps provides a snapshot of active processes on the system, we will pipe this output to identify particular processes using a grep (global regular expression print) utility and add some options that will give the desired output.
To do so, execute the below command in your Linux terminal:
$ ps -eo pid,lstart,,etime,cmd | grep -i bash OR $ ps -eo pid,lstart,,etimes,cmd | grep -i bash
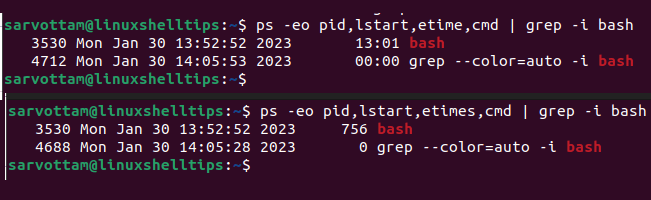
Here, etime is the elapsed time since service was started, in the form of [[DD-]hh:]mm:ss and etimes also the same with a difference in results in seconds. If you find it difficult to run the above command, you can make use of an alias to shorten it for regular use.
Instead of the application name, you can also give the process id that you can get from the output list of active processes.
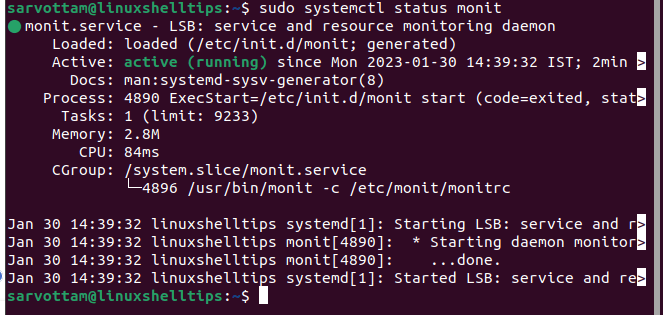
2. Find Specific Process Uptime Using Monit
Though you may first need to install it, Monit is yet another small utility for managing and monitoring processes, files, and filesystems on a Unix system along with automatic maintenance and repair.
Install Monit on Linux
$ sudo apt install monit [On Debian, Ubuntu and Mint] $ sudo yum install monit [On RHEL/CentOS/Fedora and Rocky Linux/AlmaLinux] $ sudo emerge -a monit [On Gentoo Linux] $ sudo apk add monit [On Alpine Linux] $ sudo pacman -S monit [On Arch Linux] $ sudo zypper install monit [On OpenSUSE]
Once installed, you also need to configure Monit in Linux before you start using it for process uptime. First, launch the monit daemon and check the status by running:
$ sudo monit $ sudo systemctl status monit
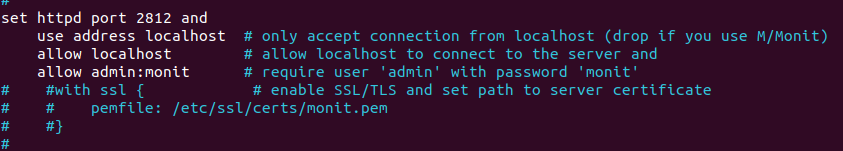
Surprisingly, Monit also provides a web interface for those who prefer a graphical interface instead of a command line. So, to enable the web interface, you need to edit the monit configuration file located mainly at /etc/monit/monitrc for Debian-based Ubuntu and Linux Mint and at /etc/monit.conf for Red-Hat-based Fedora.
Just open the file in your favorite editor:
And uncomment the following lines shown below screenshot i.e. IP address and monit admin user.
Next, you also need to restart the monit service to apply your new config changes. Enable it also if you want to auto-run during system startup.
$ systemctl start monit $ systemctl enable monit $ systemctl status monit
Now, you’re ready to access the monit web interface by navigating to the localhost URL in your browser.
As you will hit the url, it will prompt you for credentials. You can use the default “admin” as username and “monit” as password. Once entered, you’ll see the below screen.
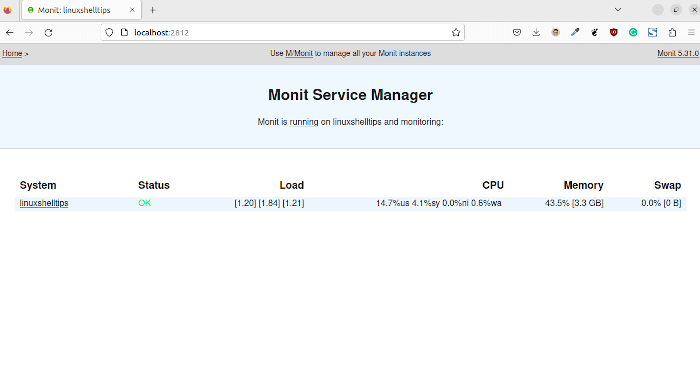
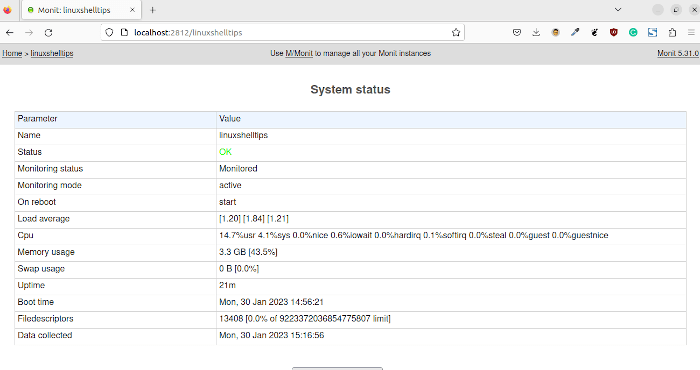
The interface will list all running processes along with other details like CPU, memory usage, boot time, and uptime.
At last, we learned to check the uptime of individual processes in Linux, but before we also need its process ID which we saw how we can get using various Linux command line tools. You can explore more above all methods to get the best-desired output in your comfortable way.