- How can I monitor the CPU temperature under linux?
- 4 Useful Tools to Monitor CPU and GPU Temperature in Ubuntu
- 1. Glances
- 2. Sensors
- 3. Hardinfo
- 4. i7z
- How to Check CPU Temperature on Linux
- Check CPU Temperature Using Lm-Sensors
- Check CPU Temperature Using Psensor
- Install Psensor
- Using Psensor
- Check Temperature Without Third-Party Utilities
How can I monitor the CPU temperature under linux?
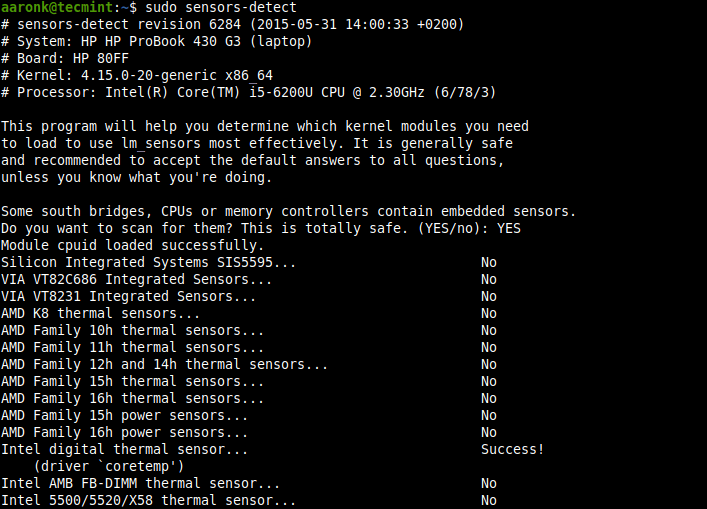
As others have noted, you need the lm-sensors package. I thought I should mention that in addition to installing the package, you should run the sensors-detect command to identify the kernel modules that need to be loaded.
If you haven’t done this, manually run this once and check if it detects any sensors on board your computer.
$ sudo sensors-detect # sensors-detect revision 5249 (2008-05-11 22:56:25 +0200) This program will help you determine which kernel modules you need to load to use lm_sensors most effectively. It is generally safe and recommended to accept the default answers to all questions, unless you know what you're doing. We can start with probing for (PCI) I2C or SMBus adapters. Do you want to probe now? (YES/no): Probing for PCI bus adapters. Use driver `i2c-i801' for device 0000:00:1f.3: Intel 82801G ICH7 We will now try to load each adapter module in turn. Module `i2c-i801' already loaded. If you have undetectable or unsupported I2C/SMBus adapters, you can have them scanned by manually loading the modules before running this script. We are now going to do the I2C/SMBus adapter probings. Some chips may be double detected; we choose the one with the highest confidence value in that case. If you found that the adapter hung after probing a certain address, you can specify that address to remain unprobed. Next adapter: SMBus I801 adapter at 10c0 (i2c-0) Do you want to scan it? (YES/no/selectively): Client found at address 0x50 Probing for `Analog Devices ADM1033'. No Probing for `Analog Devices ADM1034'. No Probing for `SPD EEPROM'. Yes (confidence 8, not a hardware monitoring chip) Probing for `EDID EEPROM'. No Client found at address 0x52 Probing for `Analog Devices ADM1033'. No Probing for `Analog Devices ADM1034'. No Probing for `SPD EEPROM'. Yes (confidence 8, not a hardware monitoring chip) Probing for `EDID EEPROM'. No Some chips are also accessible through the ISA I/O ports. We have to write to arbitrary I/O ports to probe them. This is usually safe though. Yes, you do have ISA I/O ports even if you do not have any ISA slots! Do you want to scan the ISA I/O ports? (YES/no): Probing for `National Semiconductor LM78' at 0x290. No Probing for `National Semiconductor LM78-J' at 0x290. No Probing for `National Semiconductor LM79' at 0x290. No Probing for `Winbond W83781D' at 0x290. No Probing for `Winbond W83782D' at 0x290. No Probing for `IPMI BMC KCS' at 0xca0. No Probing for `IPMI BMC SMIC' at 0xca8. No Some Super I/O chips may also contain sensors. We have to write to standard I/O ports to probe them. This is usually safe. Do you want to scan for Super I/O sensors? (YES/no): Probing for Super-I/O at 0x2e/0x2f Trying family `National Semiconductor'. No Trying family `SMSC'. Yes Found unknown chip with ID 0x2803 Probing for Super-I/O at 0x4e/0x4f Trying family `National Semiconductor'. No Trying family `SMSC'. No Trying family `VIA/Winbond/Fintek'. No Trying family `ITE'. No Some south bridges, CPUs or memory controllers may also contain embedded sensors. Do you want to scan for them? (YES/no): Silicon Integrated Systems SIS5595. No VIA VT82C686 Integrated Sensors. No VIA VT8231 Integrated Sensors. No AMD K8 thermal sensors. No AMD K10 thermal sensors. No Intel Core family thermal sensor. Success! (driver `coretemp') Intel AMB FB-DIMM thermal sensor. No Now follows a summary of the probes I have just done. Just press ENTER to continue: Driver `coretemp' (should be inserted): Detects correctly: * Chip `Intel Core family thermal sensor' (confidence: 9) I will now generate the commands needed to load the required modules. Just press ENTER to continue: To load everything that is needed, add this to /etc/modules: #----cut here---- # Chip drivers coretemp #----cut here---- Do you want to add these lines automatically? (yes/NO) If you’re lucky, your laptop will support an array of sensors. If not, you may still find a basic set of sensors for the CPU:
$ sensors acpitz-virtual-0 Adapter: Virtual device temp1: +40.5°C (crit = +105.0°C) coretemp-isa-0000 Adapter: ISA adapter Core 0: +35.0°C (crit = +100.0°C) coretemp-isa-0001 Adapter: ISA adapter Core 1: +40.0°C (crit = +100.0°C) 4 Useful Tools to Monitor CPU and GPU Temperature in Ubuntu
The CPU or GPU temperature depends entirely on the usage of running programs or applications. Sensitive computer components such as CPUs have a finite lifespan and running them at a temperature that exceeds a certain limit (or at higher temperatures generally) can shorten it. Besides, it can also cause thermal throttling especially when the fan is not providing adequate cooling.
So it is important to monitor your system’s CPU temperature to avoid damaging it as a result of overheating. In this article, we will share some useful command-line tools to help you keep a close eye on the temperature of your CPU and GPU.
1. Glances
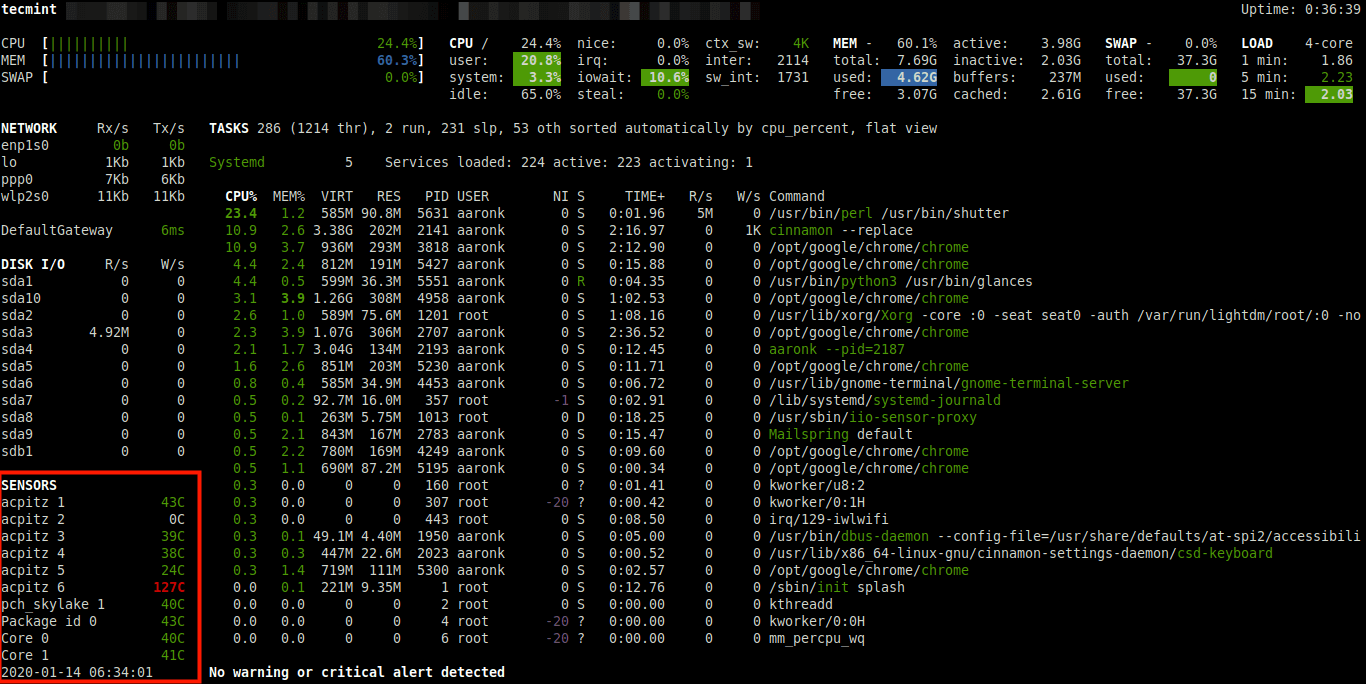
Glances is a cross-platform, advanced and popular real-time system monitoring tool that uses the psutil library to gather information from various system resources.
It can display information from sensors using the psutil and/or hddtemp tools. One of its intriguing features is the webserver mode which allows you to access it via a web browser to remotely monitor your Linux server.
There are various methods to install Glances on your system, but the preferred way of installing glances is using an auto-install script, which will install the latest production-ready version.
To install Glances on your system, use curl or wget command as shown.
# curl -L https://bit.ly/glances | /bin/bash OR # wget -O- https://bit.ly/glances | /bin/bash
Once you have installed it, start Glances and press f key to view sensors information.
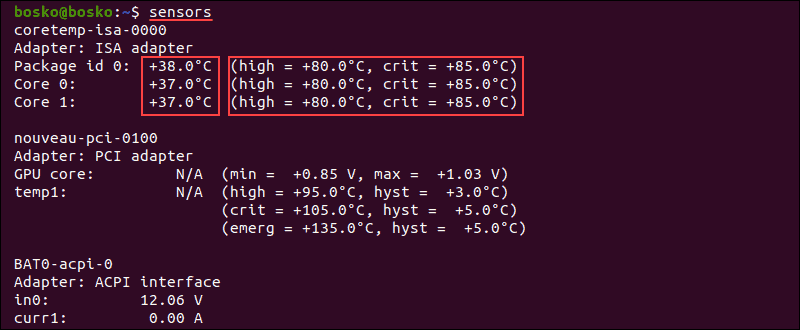
2. Sensors
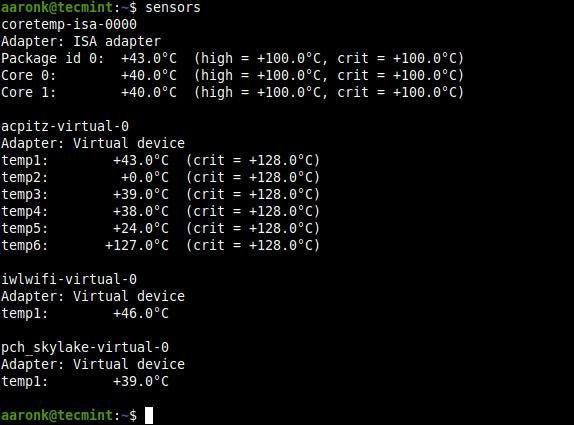
Sensors is a simple command-line utility that displays the current readings of all sensor chips including the CPU. It comes pre-installed some Linux distributions such as Ubuntu by default, otherwise install it as shown.
$ sudo apt-get install lm-sensors
Then you can run the following command to detect all sensors on your system.
Once detected, you can run the following command to check CPU temperature, GPU temperature, fan speed, voltage, etc.
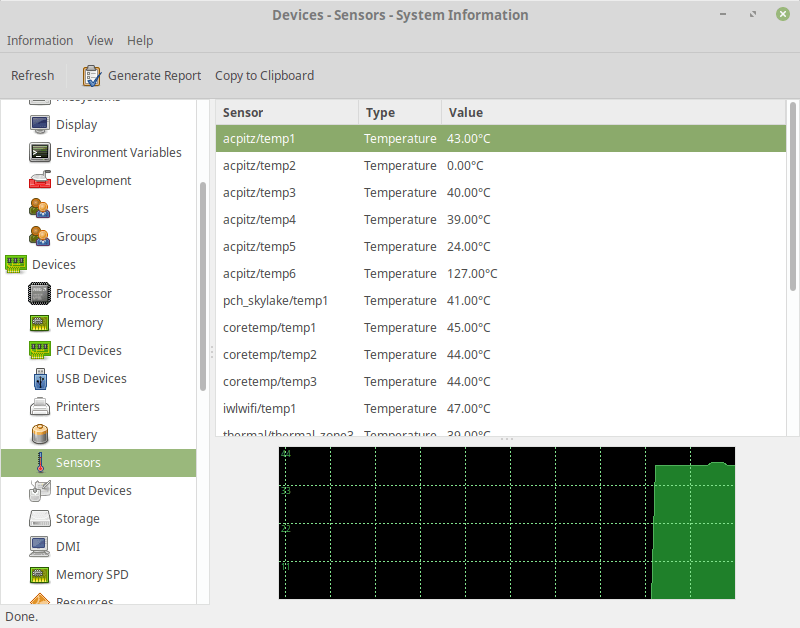
3. Hardinfo
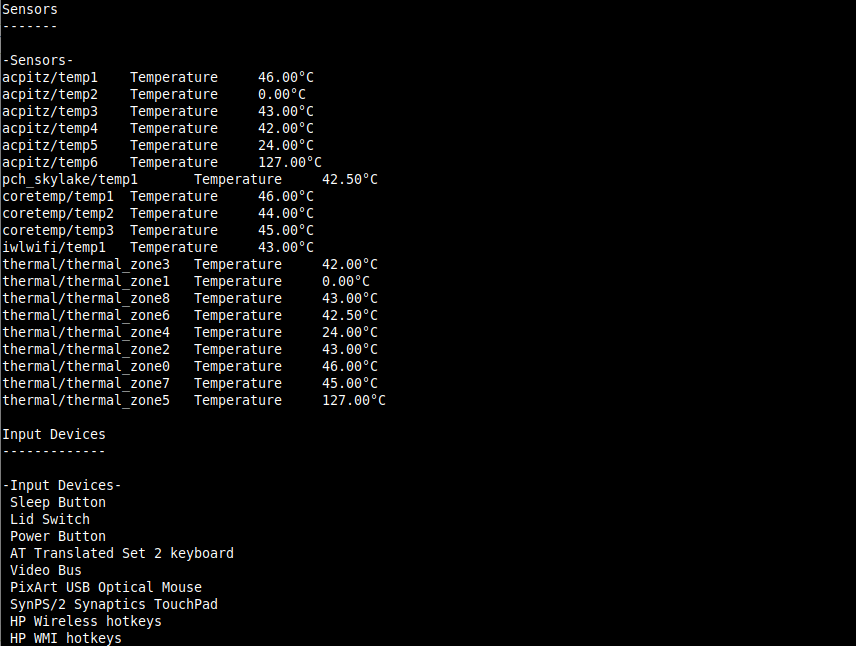
Hardinfo is a lightweight system profiler and benchmark tool designed for hardware analysis and report generation. It features comprehensive reports on system hardware and allows for the generation of HTML reports on your system’s hardware.
To install the hardinfo package on your Ubuntu Linux system, run the following command.
$ sudo apt install hardinfo
After the installation is complete, you can launch hardinfo to view devices’ information by running the following command.
To launch the GUI app, simply run the following command or search for ‘System Profiler and Benchmark’ in the system menu or Dash and open it.
Then click on sensors to view sensors information as shown in the following screenshot.
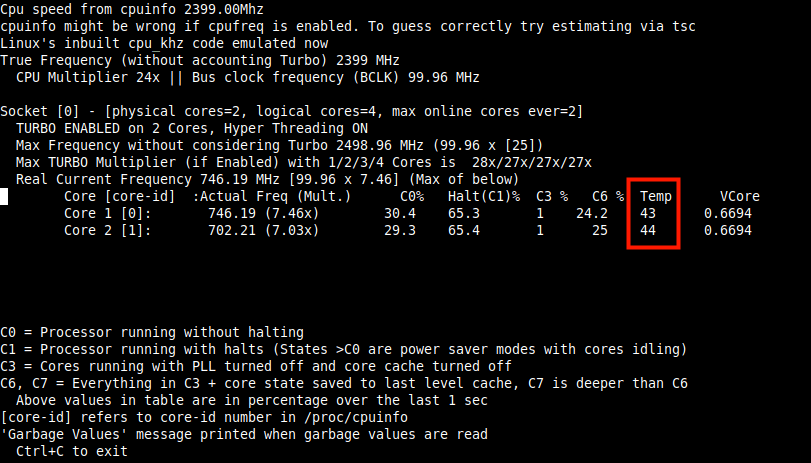
4. i7z
i7z is a tiny command-line utility that reports Intel Core i7, i5, i3 CPU information including temperatures. You can install it on your Ubuntu system by running the following command.
Once installed, run i7z with root privileges as shown.
You might also like to read these useful related articles.
That’s all for now! In this article, we have shared the useful command-line tools for viewing CPU and GPU temperatures in a Ubuntu system. Have your say about this article or ask questions via the feedback form below.
How to Check CPU Temperature on Linux
Like any electrical component, CPUs generate heat when being used. Some resource-demanding programs cause the CPU to increase the clock speed, which results in higher temperatures. Dust buildup also causes the CPU to overheat.
High temperatures shorten the lifespan of sensitive components, so keeping track of CPU temperatures is crucial. This way, you prevent performance throttling or component damage.
In this tutorial, you will learn how to use different tools and in-built utilities to check CPU temperature on Linux machines.

Check CPU Temperature Using Lm-Sensors
Lm-sensors is a command-line utility for hardware monitoring. Use the tool to check the temperature of the CPU and other components. Follow these steps to install and configure Lm-sensors:
1. Open the terminal and install these packages using a package manager for your distribution. In Ubuntu, use the following command:
sudo apt install hddtemp lm-sensorsWait for the lm-sensors and hddtemp to finish downloading and installing.
2. Execute the sensors command to see the CPU temperature. The output shows the current temperature readings of all sensors in the machine. The results include the temperature of each core and maximum thresholds.
3. To check SSD and hard drive temperatures, execute the following command:

The output shows the temperature of the selected disk.
4. To see which system components you can monitor, run sudo sensors-detect .
Answer YES to multiple scanning requests until the system scan is complete.
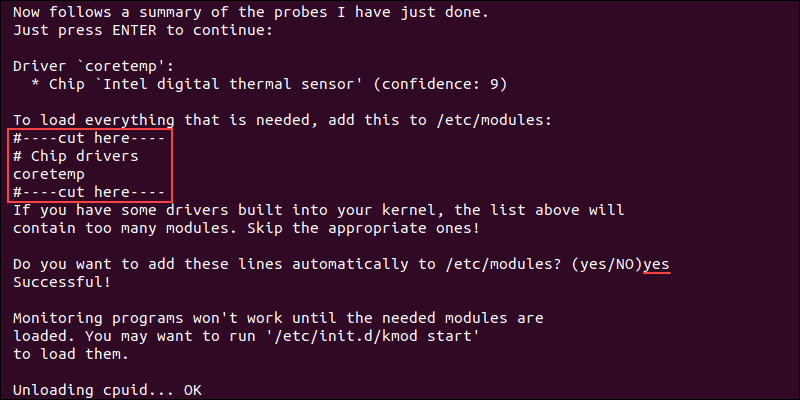
When the scan completes, the output shows the summary.
5. To ensure that system monitoring works, load the needed modules using the following command:

6. To run the sensors command repeatedly and get real-time data in the terminal, execute the following command:
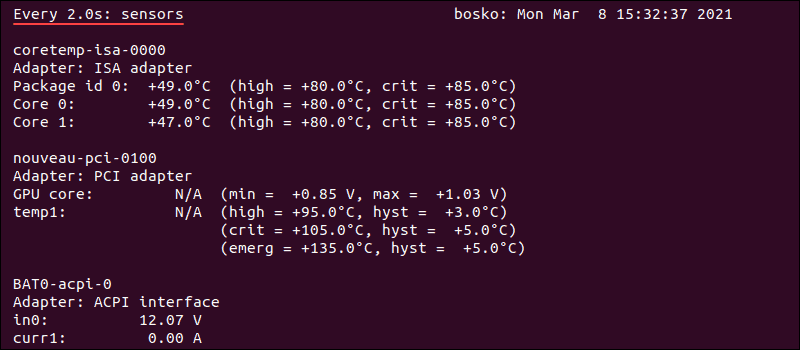
The output refreshes every two seconds and displays the current CPU temperature reading.
Note: To check CPU usage on Linux, read our tutorial on How to check CPU usage.
Check CPU Temperature Using Psensor
Psensor is a GUI app that allows you to monitor the temperature of various system components. This utility also allows you to monitor CPU usage and fan speed.
Psensor includes an applet indicator for Ubuntu, allowing you to display the temperature in the top panel to notify you when the temperatures get too high.
Install Psensor
Before installing Psensor, you need to install and configure Lm-sensors.
1. Run this command to install the necessary packages:
sudo apt install lm-sensors hddtemp2. Next, scan for sensors in your machine:
Answer YES to any scan requests until the scan is completed.
3. To make sure the packages are installed, execute the sensors command.
4. Update the package repository with sudo apt update .
5. Install Psensor using the following command:
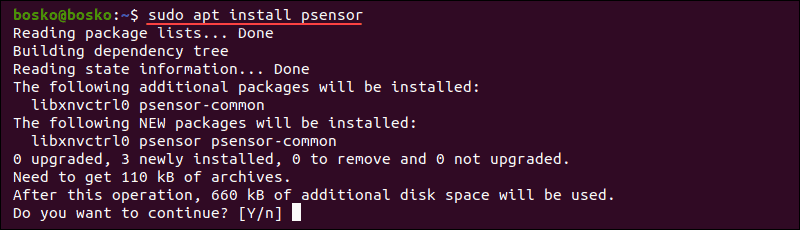
Answer YES and wait for the installation to finish.
Using Psensor
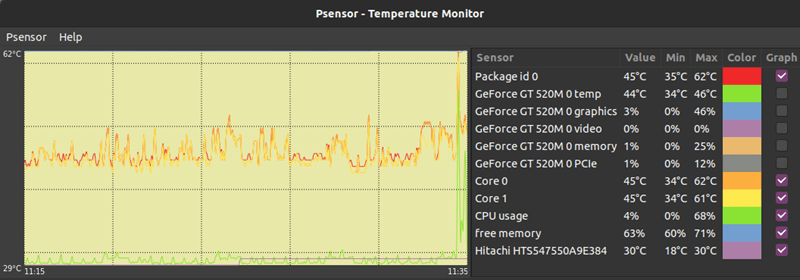
Search for Psensor in the app menu and open the utility. The app displays a graph of the selected values and shows the CPU temperature, CPU and memory usage, free RAM, GPU temperature, and HDD temperature.
To configure Psensor and set which stats you want to see, follow these steps:
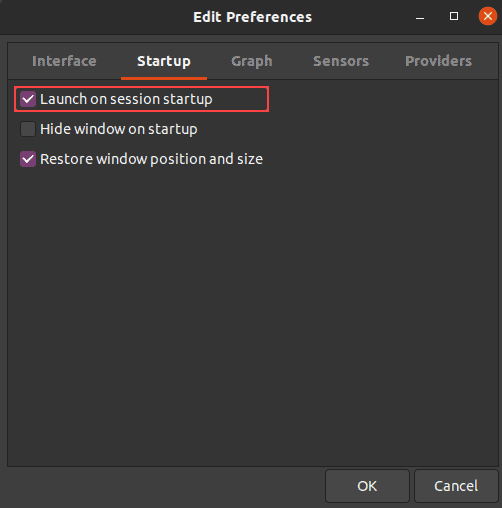
1. Click Psensor in the menu bar, followed by Preferences.
2. Check off the boxes for the options you want – whether Psensor launches on system startup, the update interval, graph colors, etc.
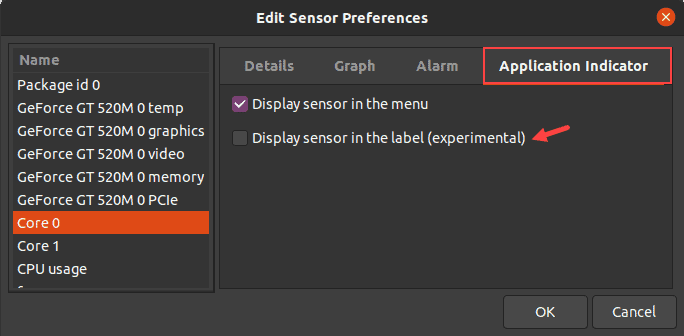
3. To show CPU or HDD temperatures in the top panel, go to Sensor Preferences under the Application Indicator. Enable the Display sensor in the label option.
Note: Learn more about monitoring CPU performance by referring to our article on Linux perf, a lightweight command-line utility.
Check Temperature Without Third-Party Utilities
There is a way to use the in-built utilities to check the CPU temperature if you don’t want to use third-party apps.
1. To check the CPU temperature without installing a third-party app, use the following command:
cat /sys/class/thermal/thermal_zone*/temp
The output shows the CPU temperature in the five-digit format. Here, 49000 means 49C.
2. If you get several thermal zones and different temperatures, execute the following command to see what a single thermal zone represents:
For example, run cat /sys/class/thermal/thermal_zone2/type to see the type of thermal zone 2.
The CPU temperature is in the zone labeled x86_pkg_temp.
3. To see what all the thermal zones are referring to, use:
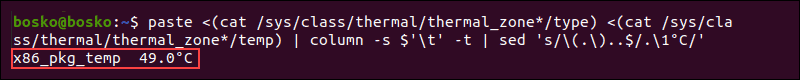
The output shows the last stored temperature for that thermal zone in degrees Celsius. In this example, there is only one thermal zone, labeled x86_pkg_temp, which represents the CPU temperature.
You now know how to check CPU temperature on Linux using various utilities. The guide also showed how to configure the tools to display other information, such as GPU and HDD temperature.