- Debug your PHP code on Remote Linux server using PHPStorm and xDebug with its port forwarding through SSH
- Remote Server’s steps
- Install xDebug
- Check port availability
- Configure xDebug:
- Configure PHP_IDE_CONFIG through Nginx
- Restart the services:
- Enable SSH Port Forwarding
- Local Machine’s steps
- Setup PHPStorm
- Create PHP Remote Debug
- Port forwarding
- Run Debug
- Diving deeper
- tcpdump showing xDebug activity
- Useful links:
- How to install Xdebug and use it in PHP on Ubuntu?
- Install Xdebug for PHP
- Configure the Xdebug extension
- Restart the webserver
- Verifying the Xdebug Installation
- Configure Xdebug in VSCode
- Debugging PHP script using Xdebug
- Conclusion
- About the author
- Fahmida Yesmin
Debug your PHP code on Remote Linux server using PHPStorm and xDebug with its port forwarding through SSH
One e-commerce site had a very strange issue, it stop working as expected after cache cleaning. This issue appeared only on production server and couldn’t be reproduced on local machine. So there wasn’t another solution how debug problem directly on the server.
It’s really important to closely check all configuration because one little mistake and you will spend hours or days to find out a problem. I spent 2 days, before I clarified that port on the server had been used by another process.
This tutorial will explain steps by steps how to debug PHP codes on remote Ubuntu 64-bit Server with PHP-FPM (FastCGI Process Manager), PHP 7.2 and Nginx.
Remote Server’s steps
Install xDebug
sudo apt install php-xdebugCheck port availability
xDebug will need a port (usually its port 9000). To make sure the port that we will use for xDebug is available, lets check which ports are in use:
It will display something like this:
COMMAND PID USER FD TYPE DEVICE SIZE/OFF NODE NAME php-fpm7. 15224 root 12u IPv4 7878655 0t0 TCP localhost.localdomain:9000 (LISTEN)Since port 9000 is already used (by PHP-FPM pool), we will use port 9005 for our xDebug.
Configure xDebug:
sudo vi /etc/php/7.2/mods-available/xdebug.iniAdd the following code into it:
; Enable xdebug extension module zend_extension=xdebug.so xdebug.idekey = PHPSTORM xdebug.default_enable=1 xdebug.remote_autostart = 0 xdebug.remote_enable = 1 xdebug.remote_handler = dbgp xdebug.remote_host = 127.0.0.1 xdebug.remote_log = /tmp/xdebug_remote.log xdebug.remote_mode = req xdebug.remote_port = 9005 # if you want to change the port you can changeConfigure PHP_IDE_CONFIG through Nginx
Open configuration file of your site and add next line:
We will use this value serverName=print-machine when will configure PHPStorm.
NOTE: This step can be omitted, but in that case PHPStorm will automatically create configuration on first request, you’ll need just press «Apply» in popup window.
Restart the services:
sudo systemctl restart php-fpm sudo systemctl restart nginxEnable SSH Port Forwarding
Make sure that Allow TCP forwarding is enabled in your SSH server settings:
sudo systemctl restart sshdLocal Machine’s steps
Setup PHPStorm
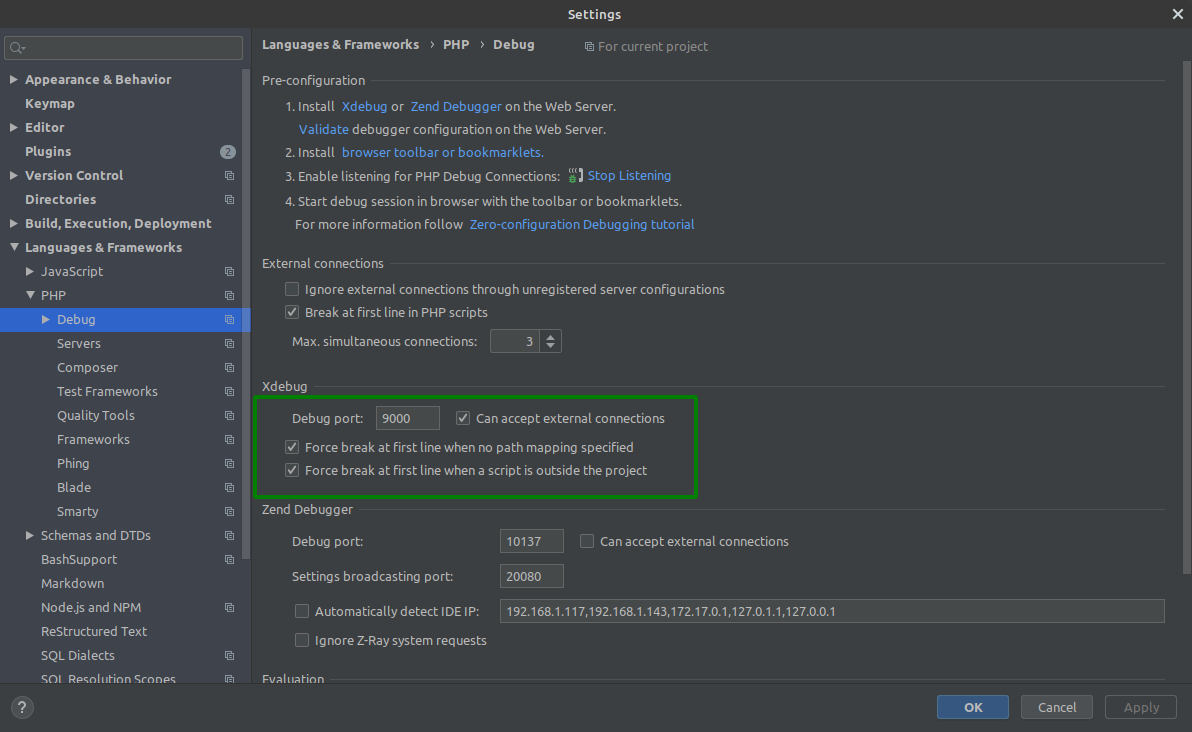
Click «File» > «Settings…» > «Languages & Frameworks» > «PHP» > «Debug». Under «Xdebug» change the «Debug port» to your desired port. In out case we leave it default 9000.
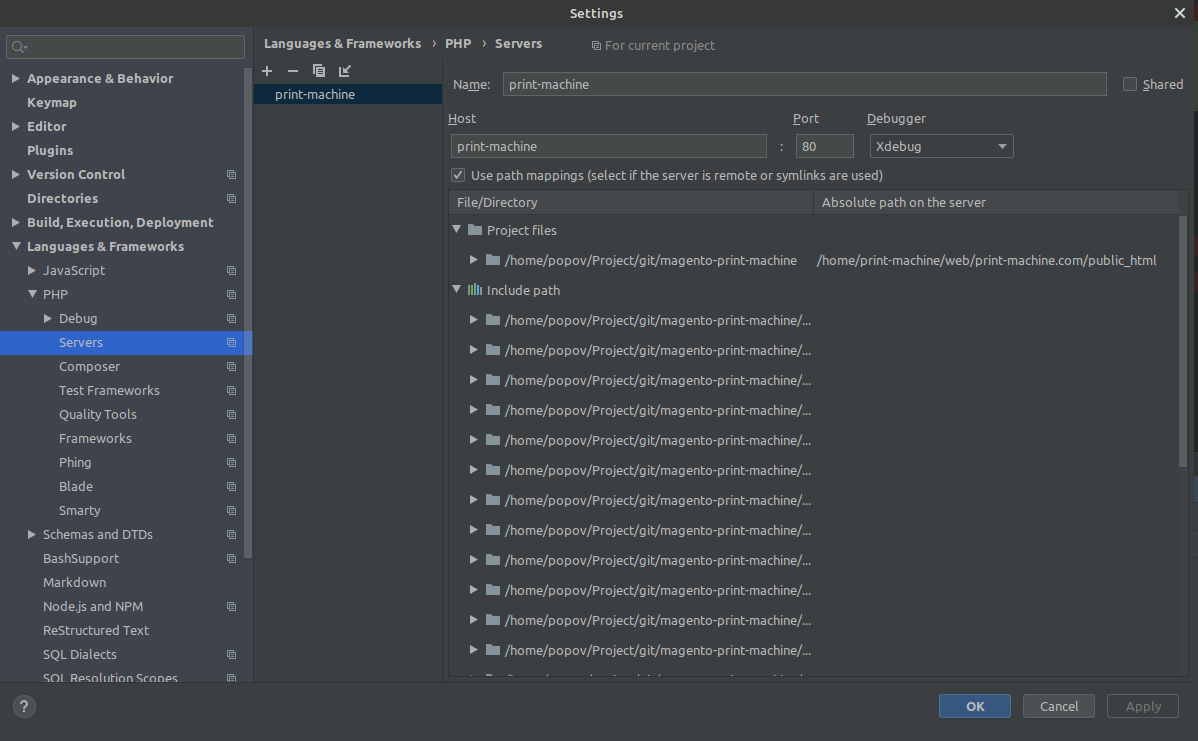
Click Servers next to Debug and create new Server configuration.
Name and Host must be the same as we write in Nginx configuration PHP_IDE_CONFIG «serverName=print-machine» . Don’t forget enable file mapping: left side – path to local project, right side – path to code on the server.
Create PHP Remote Debug
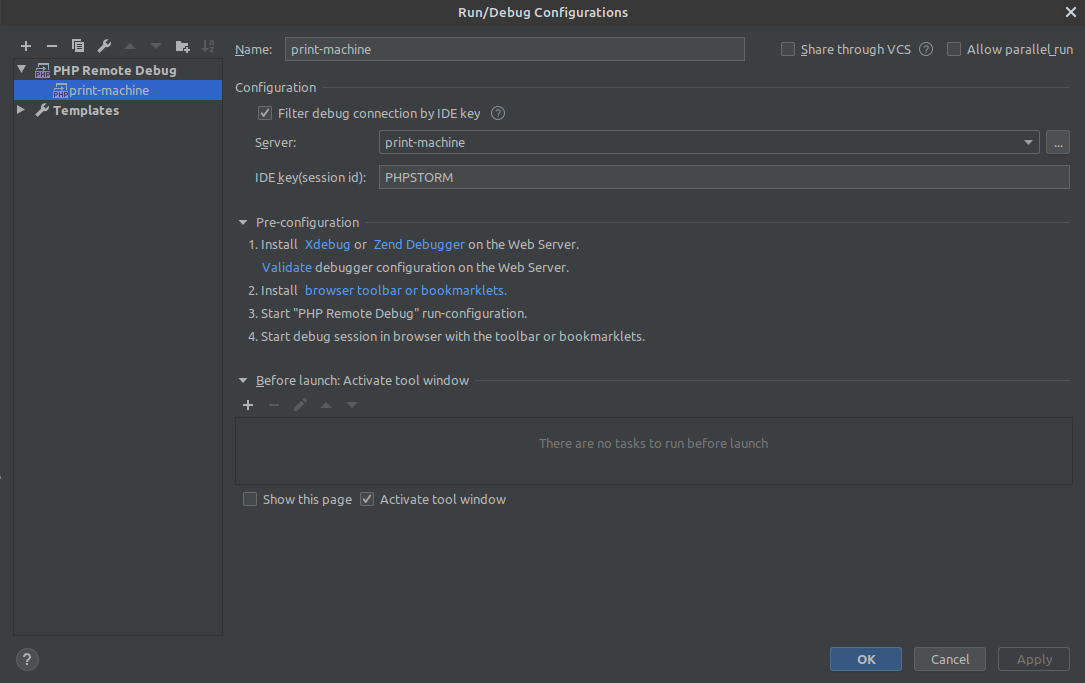
Click «Run» > «Edit configuration…», create new PHP Remote Debug . In Server select server which we created previously, IDE key (session id) should be PHPSTORM:
Port forwarding
We will use SSH tunnel port forwarding for connecting to xDebug from PHPStorm.
Execute the following command in terminal:
- -R 9005:127.0.0.1:9000 opens up port 9005 as we set the server’s xDebug’s xdebug.remote_port to 9005 earlier, then forwarded to localhost:9000 where PHPStorm is listening
- @ are the username and hostname of the server
Nothing special you won’t see, it’ll open new session, connect to remote server and do port forwarding. Vualia!
Now, to test if the SSH tunnel port forwarding works, run the following command inside your SSH prompt on remove server:
You should see something like this as response:
COMMAND PID USER FD TYPE DEVICE SIZE/OFF NODE NAME sshd 30935 print-machine 9u IPv6 7824135 0t0 TCP ip6-localhost:9005 (LISTEN) sshd 30935 print-machine 10u IPv4 7824136 0t0 TCP localhost.localdomain:9005 (LISTEN)Run Debug
- In your PhpStorm, click «Run» > «Break at first line in PHP scripts». This is optional, it is just to ensure that the PHPStorm will trigger when we started to debug our site. To start the PHPStorm listening to xDebug, click «Run» > «Start Listening for PHP Debug Connections».
- Open your favorite web browser and visit your site. This should pop a window at PHPStorm that there’s incoming connection from xDebug, just click the «Accept» button.
- Your PHPStorm will trigger to stop and highlight at the first line in your site’s PHP script.
Diving deeper
If still having problems you can use following tools in order to find the point where it fails:
tcpdump showing xDebug activity
You can use tcpdump command in order to verify if xDebug is even trying to connect to local machine — and if it does — which target it is trying to connect to.
sudo tcpdump -vv -nn -i any dst port 9000tcpdump: listening on any, link-type LINUX_SLL (Linux cooked), capture size 262144 bytes 23:50:31.531794 IP (tos 0x0, ttl 64, id 9877, offset 0, flags [DF], proto TCP (6), length 60) 127.0.0.1.45240 > 127.0.0.1.9000: Flags [S], cksum 0xfe30 (incorrect -> 0x6efe), seq 3410588541, win 65495, options [mss 65495,sackOK,TS val 3683447502 ecr 0,nop,wscale 7], length 0 This log shows that xDebug on the remote server (127.0.0.1) connects to my host machine (127.0.0.1) on port 9000. This information is very helpful to get a starting point for further debugging.
With the nc command you can debug connectivity issues:
nc -w5 -z -v 127.0.0.1 9000 Connection to 127.0.0.1 9000 port [tcp/*] succeeded!nc connecting from within the remote server to the host machine at port 9000
With this we have verified that there is no connectivity issue due to wrong configuration or network restrictions.
Useful links:
How to install Xdebug and use it in PHP on Ubuntu?
![]()
When any programming code generates unexpected output, it requires to find out the reason behind the error of the output to solve the problem. Debugging is the best way to find out the reason for the unexpected output of the code by tracing the code step by step.
Normally, print_r() and var_dump() functions are used to check the output of the variables. Xdebug extension is used in PHP for an advanced level of debugging. This extension is not installed in PHP by default. You have to install it and set up the necessary configurations to use its features. How the Xdebug extension can be installed and configured in PHP and integrated with the Visual Studio Code editor on Ubuntu is shown in this tutorial.
Install Xdebug for PHP
Run the following command from the terminal to install the Xdebug extension for the installed PHP version 7+.
You will get the following output if the extension is installed properly in the system.

Configure the Xdebug extension
Run the following command to create the configuration file named xdebug.ini. You have to set the path of the mods-available folder properly based on your installed PHP version. According to the path used in the command, PHP version 7.4 is installed in the current system.
Add the following lines in the file to set the necessary configurations to enable the Xdebug extension for PHP.
xdebug . remote_autostart = 1
xdebug . remote_enable = 1
xdebug . remote_handler = dbgp
xdebug . remote_host = 127 . 0 . 0 . 1
xdebug . remote_log = / tmp / xdebug_remote . log
xdebug . remote_mode = req
xdebug . remote_port = 9005 #this can be modified
Restart the webserver
Run the following command with root privilege to restart the Apache server.
Verifying the Xdebug Installation
Run the following command to check if the Xdebug is installed properly or not. If the extension is installed properly, then the following command will show the information of the installed Xdebug version with PHP version.
The following output shows that Xdebug version 2.9.6 is installed.

Configure Xdebug in VSCode
If the Visual Studio code editor is opened before installing the Xdebug extension, then re-open it. Open the Extensions window by clicking the View menu or pressing Ctrl+Shift+x. Type “PHP debug” in the search box of the Extensions window. You will get the following information if the Xdebug extension is integrated properly with this editor.

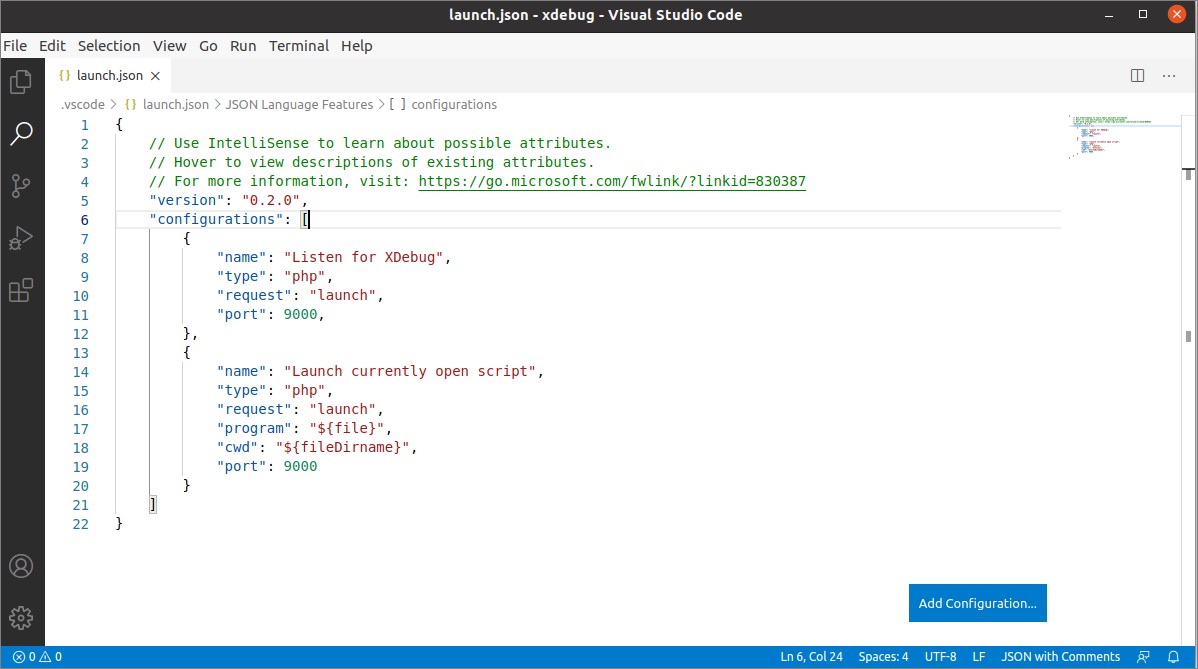
Open the configuration file of Xdebug by clicking ‘Add Configuration…’ from the menu Run and set the necessary configuration according to the xdebug.ini file.
Debugging PHP script using Xdebug
Create a PHP file with the following script to show the way of using Xdebug debugger.
//Define a site type
$sitetype = «Search Engine» ;
//Define the site types
$site1 = ‘yahoo.com’ ;
$site2 = ‘hi5.com’ ;
$site3 = ‘aliexpress.com’ ;
//Check the value of the $sitetype variable
switch ( $sitetype )
{
//Define array based on the match and search site in the array
case ‘Search Engine’ :
$array = Array ( ‘google.com’ , ‘ask.com’ , ‘bing.com’ ) ;
if ( in_array ( $site1 , $array ) )
echo » $site1 is a search engine site.» ;
else
echo » $site1 does not exist in the list.» ;
break ;
case ‘Social Network’ :
$array = Array ( ‘facebook.com’ , ‘twitter.com’ , ‘snapchat.com’ ) ;
if ( in_array ( $site2 , $array ) )
echo » $site2 is a social networking site.» ;
else
echo » $site2 does not exist in the list.» ;
break ;
case ‘E-commerce’ :
$array = Array ( ‘aliexpress.com’ , ‘ebay.com’ , ‘daraz.com’ ) ;
if ( in_array ( $site1 , $array ) )
echo » $site3 is a e-commerce site.» ;
else
echo » $site3 does not exist in the list.» ;
break ;
default :
echo «Unknown site.» ;
}
?>
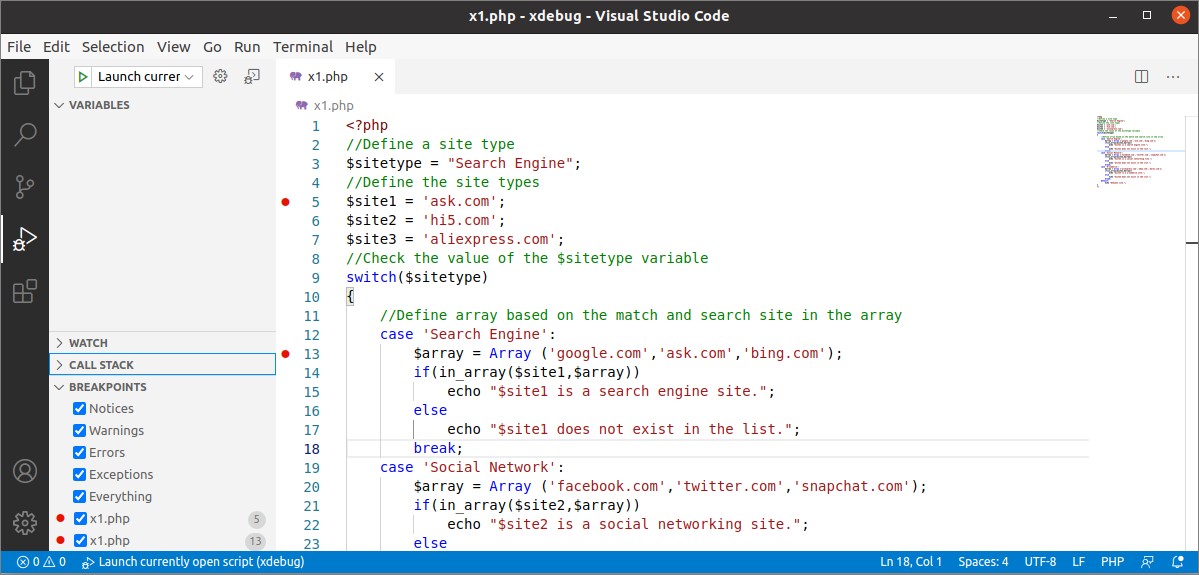
Select the line in the script and press F9 or click Toggle Breakpoint from the Run menu to set the breakpoint in the script; multiple breakpoints can be set. Click on the Run button from the left side of the editor to see the details of the debugging information. In the following output, two breakpoints are set in line 5 and line 13.
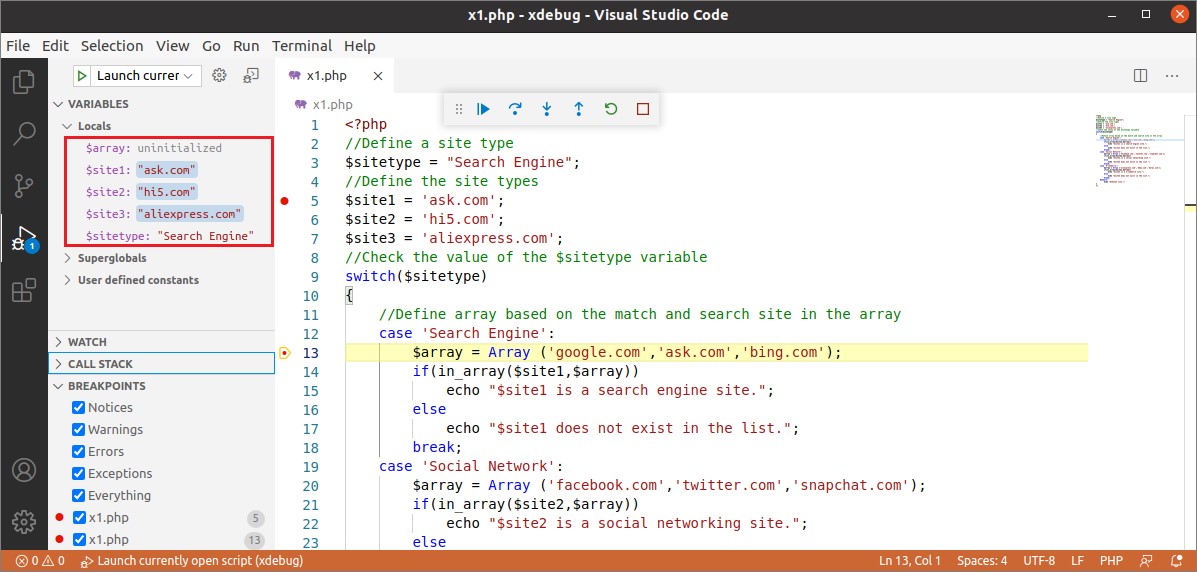
Now, press F5 or click on Start Debugging from the Run menu to start the debugging by using Xdebug. A toolbar will appear, like the following image for the debugging, and the script will stop its execution at the first breakpoint that is in line 5. In the left window, which variables are initialized and not initialized after executing the script at line 5 is shown.

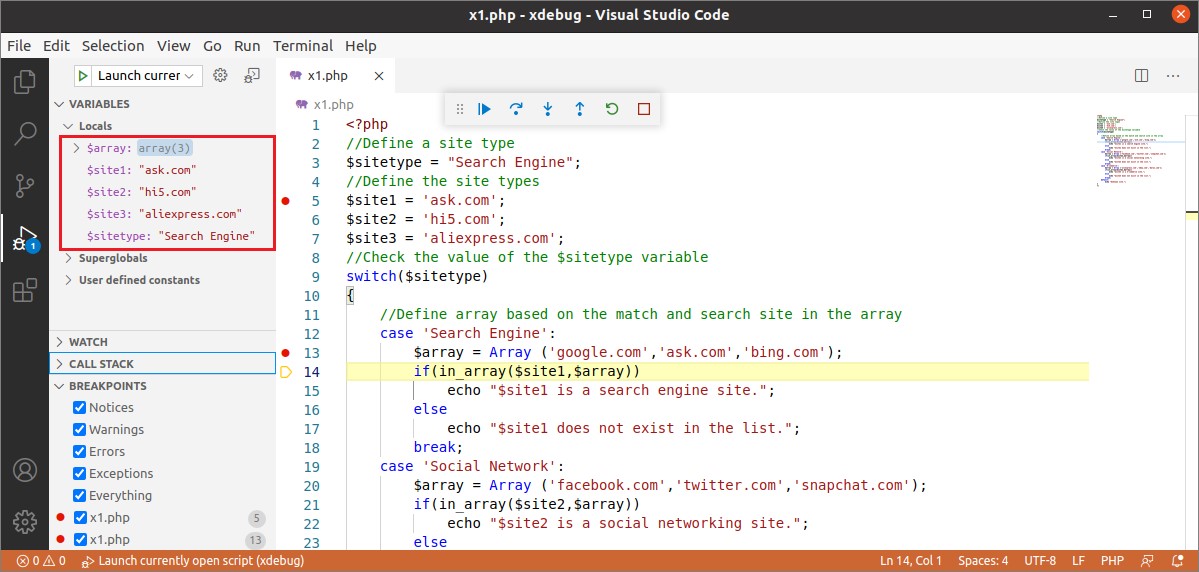
The first icon of the toolbar is used to continue the script and to go to the next breakpoint (F5 can be used for this purpose). If F5 is pressed, after starting the debug, it will go to the next breakpoint that is in line 13. At this line, some variables will be initialized.
The second icon is used to step over the script and to go to the line according to the script (F10 can be used for this purpose).
The third icon is used to step into the breakpoint line (F11 can be used for this purpose).
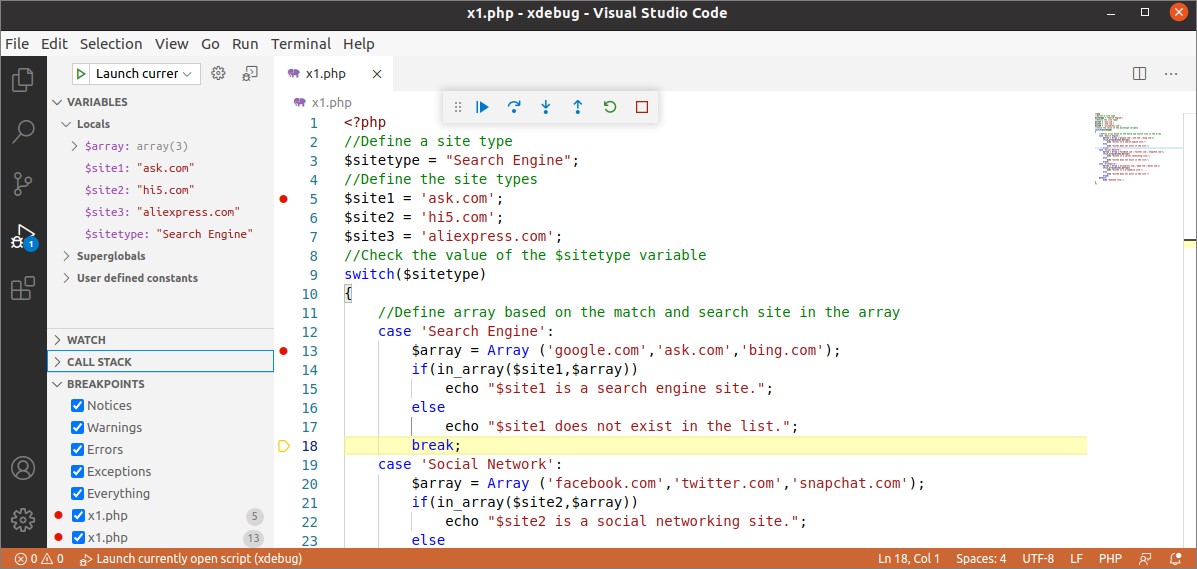
The fourth icon is used to step out from all breakpoint lines (Shift+F11 can be used for this purpose). The fifth icon is used to restart the debugging (Ctrl+Shift+F5 can be used for this purpose). The sixth icon is used to stop the debugging (Shift+F5 can be used for this purpose).
Conclusion
Xdebug is a useful extension of PHP used for debugging the script deeply. It helps the coder to find the reason for the complicated errors of the script easily. The way of using this extension is different for the different editors. How this extension for PHP can be installed and configured for the Visual Studio editor on Ubuntu has been explained here. The use of this extension for debugging is also shown using a simple PHP script. This tutorial will help the readers who want to learn the advanced level of debugging for PHP script using Xdebug extension and VSCode editor.
About the author
Fahmida Yesmin
I am a trainer of web programming courses. I like to write article or tutorial on various IT topics. I have a YouTube channel where many types of tutorials based on Ubuntu, Windows, Word, Excel, WordPress, Magento, Laravel etc. are published: Tutorials4u Help.