- Linux Applications Debugging Techniques/The debugger
- The «symbol server» [ edit | edit source ]
- Source Code [ edit | edit source ]
- Remote debugging [ edit | edit source ]
- Attaching to a process [ edit | edit source ]
- Debugging programs that spawn multiple children [ edit | edit source ]
- Embedding breakpoints in the source [ edit | edit source ]
- Execute commands on breakpint [ edit | edit source ]
- Data breakpoints (watchpoints) [ edit | edit source ]
- Breakpoints conditional on caller [ edit | edit source ]
- The text user interface [ edit | edit source ]
- .gdbinit [ edit | edit source ]
- C++ support [ edit | edit source ]
- References [ edit | edit source ]
- Debug .NET Core on Linux using SSH by attaching to a process
- Prerequisites
- Prepare your application for debugging
- Build and deploy the application
- Attach the debugger
- Feedback
Linux Applications Debugging Techniques/The debugger
Someday some hard to reproduce issue will be found on a production machine. Typically, such a machine is difficult to access, has no development environment and nothing can be installed on it. At most it will have gdb, but very likely not. Typically also, the heaviest user will be the one to find the issue and typically still, the heaviest user is the one being the bigger — money-wise. And that issue has to be root cause diagnosed and fixed.
Unless the application has been prepared for this forensic gathering moment, not much can be done to diagnose where the issue is. Thus, preparations should start with compilation:
- Have a «symbol server» and make sure it is reacheable. Compile on the symbol server.
- Compile the release with debugging symbols. Strip them if you do not want to ship them but keep them.
- Ship gdbserver with the application for remote debugging.
These preparations will allow one to:
- Debug the application running on any machine, including machines where there is no gdb installed.
- Debug from any machine that has network visibility to the symbol server.
Also, think beforehand how would you debug on the machine:
- Embed a breakpoint in the code, at hard of reach places of interest, then
- Start the application
- Attach to it with the debugger
- Wait until the breakpoint is hit
The «symbol server» [ edit | edit source ]
One way to easily reach the right code from within the debugger is to build the binaries within an auto-mounted folder, each build in its own sub-folder. The same auto-mount share should be accessible from the machine you are debugging on.
Debian [ edit | edit source ]
# Build directory: rw for localhost, read-only for any other host /home/amelinte/projects/lpt/lpt localhost(rw,sync,no_subtree_check) *(ro,root_squash,no_subtree_check)
/etc/init.d/autofs restart /etc/init.d/nfs-kernel-server restart /usr/sbin/exportfs -a
Redhat [ edit | edit source ]
Finally, build the binaries within the automounted directory on the build machine (here the build machine is bear):
cd /net/bear/home/amelinte/projects/lpt/lpt.destructor make clean makeNotice the filename path that is resolved with the symbol information:
[0x413464] lpt::stack::call_stack::call_stack(bool)+0x52 At /net/bear/home/amelinte/projects/lpt/lpt.destructor/lpt/include/lpt/call_stack.hpp:74 In binaries/bin/stacktest
If the symbols have been stripped from the binaries, point gdb to the folders where the symbols are with the debug-file-directory directive.
References [ edit | edit source ]
Source Code [ edit | edit source ]
To point the debugger to the source files:
(gdb) set substitute-path /from/path1 /to/path1 (gdb) set substitute-path /from/path2 /to/path2
Remote debugging [ edit | edit source ]
- On the machine where the application runs (appmachine):
- If gdbserver is not present, copy it over.
- Start the application.
- Start gdbserver: gdbserver gdbmachine:2345 --attach program
- At the gdb prompt, enter: target remote appmachine:2345
Sometimes you may have to tunnel over ssh:
- On gdbmachine:
- ssh -L 5432:appmachine:2345 user@appmachine
- At the gdb prompt: target remote localhost:5432
References [ edit | edit source ]
Attaching to a process [ edit | edit source ]
Find out the PID of the process, then:
(gdb) attach 1045 Attaching to process 1045 Reading symbols from /usr/lib64/firefox-3.0.18/firefox. (no debugging symbols found). done. Reading symbols from /lib64/libpthread.so.0. (no debugging symbols found). done. [Thread debugging using libthread_db enabled] [New Thread 0x448b4940 (LWP 1063)] [New Thread 0x428b0940 (LWP 1054)] . (gdb) detach
Debugging programs that spawn multiple children [ edit | edit source ]
- set detach-on-fork off
- see «all-stop» vs «non-stop» modes in the GDB documentation and their related settings
Embedding breakpoints in the source [ edit | edit source ]
#define EMBEDDED_BREAKPOINT asm volatile ("int3;")#define EMBEDDED_BREAKPOINT \ asm("0:" \ ".pushsection embed-breakpoints;" \ ".quad 0b;" \ ".popsection;")
This will break into the debugger on hard to reach conditions:
References [ edit | edit source ]
Execute commands on breakpint [ edit | edit source ]
b bigFoot commands bt continue end
Data breakpoints (watchpoints) [ edit | edit source ]
Watchpoints can be implemented either in software either in hardware if the CPU supports it. Typically on an Intel processor there are eight debug registers out of which only four can be used for hardware breakpoints and this limits the number of watchpoints system wide.
Breakpoints conditional on caller [ edit | edit source ]
This requires gdb 7.9 or later, configured with python support:
(gdb) break funcA if $_caller_is("funcB")
The text user interface [ edit | edit source ]

GDB features a text user interface for code, disassembler and registers. For instance:
- Ctrl-x 1 will show the code pane
- Ctrl-x a will hide the TUI panes
None of the GUI interfaces to gdb (Qt Creator stands out for being intuitive and easy to use) can offer access to all of the gdb functionality.
curses gdb offers an improved TUI. A comprehensive list of debugger GUIs is available here.
Reverse debugging [ edit | edit source ]
As an example, reverse debugging is a functionality no GUI offers access to:
(gdb) l 1 /* 1 */ int var; 2 /* 2 */ int main (void) 3 /* 3 */ int i; for (i=0;i100;i++) 4 /* 4 */ var=i/10; 5 /* 5 */ return 0; > (gdb) start (gdb) record (gdb) adv 5 main () at history.c:5 5 /* 5 */ return 0; > (gdb) watch var Hardware watchpoint 2: var (gdb) reverse-continue Continuing. Hardware watchpoint 2: var Old value = 9 New value = 8 0x00000000004004c3 in main () at history.c:4 4 /* 4 */ var=i/10; (gdb) p i $1 = 90 (gdb) reverse-continue Continuing. Hardware watchpoint 2: var Old value = 8 New value = 7 0x00000000004004c3 in main () at history.c:4 4 /* 4 */ var=i/10; (gdb) p i $2 = 80
Register watch [ edit | edit source ]
You can watch registers. Note this will force the debugger to single step the debugged program and it will run very slowly:
References [ edit | edit source ]
.gdbinit [ edit | edit source ]
As a note, in upcoming gdb releases, .gdbinit will be replaced by gdb-gdb.gdb:
gdb-gdb.gdb ^ ^ ^ | | |---- It's a gdb script. | | If it were Python this would be .py. | | | --------- "-gdb" is a gdb convention, it's the suffix added to a file | for auxiliary support. | E.g., gdb will auto-load libstdc++.so-gdb.py (version elided) | which contains the std c++ pretty-printers. | ------------- This init script is for the program named "gdb". If this were for readelf the script would be named readelf-gdb.gdb.
C++ support [ edit | edit source ]
Canned gdb macros [ edit | edit source ]
Mangling [ edit | edit source ]
gdb might need a bit of guidance with C++11 binaries:
(gdb) set cp-abi gnu-v3 (gdb) set language c++ (gdb) maintenance demangle _ZNSt16nested_exceptionD2Ev std::nested_exception::~nested_exception()
Templates [ edit | edit source ]
One can eventually use templight to debug and profile templates.
Getting the subclass from the base class pointer [ edit | edit source ]
(gdb) python print(x.type) SuperClass * (gdb) python print(x.dynamic_type) SubClass *
References [ edit | edit source ]
Debug .NET Core on Linux using SSH by attaching to a process
Applies to:
Visual Studio Visual Studio for Mac Visual Studio CodeStarting in Visual Studio 2017, you can attach to .NET Core processes running on a local or remote Linux deployment over Secure Shell (SSH). This article describes how to set up debugging and how to debug. For debugging scenarios using Docker containers, see Attach to a process running on a Docker container and the container tools articles instead. To debug Linux on WSL 2 from Visual Studio (no attach to process), see Debug .NET Core Apps in WSL 2 with Visual Studio.
For debugging Linux running on Azure Kubernetes Service (AKS), Bridge to Kubernetes is recommended instead of attach to process.
Prerequisites
- On the Linux server, you need to install SSH server, unzip and install with either curl or wget. For example, on Ubuntu you can do that by running:
sudo apt-get install openssh-server unzip curlPrepare your application for debugging
To prepare your application for debugging:
- Consider using a Debug configuration when you build the application. It is much harder to debug retail-compiled code (a Release configuration) than debug-compiled code. If you need to use a Release configuration, first disable Just My Code. To disable this setting, choose Tools >Options >Debugging, and then deselect Enable Just My Code.
- Make sure your project is configured to produce portable PDBs (which is the default setting), and make sure the PDBs are in the same location as the DLL. To configure this in Visual Studio, right-click the project, then choose Properties >General >Debug symbols.
- Make sure your project is configured to produce portable PDBs (which is the default setting), and make sure the PDBs are in the same location as the DLL. To configure this in Visual Studio, right-click the project, then choose Properties >Build >Advanced >Debugging Information.
Build and deploy the application
You can use several methods to deploy the app prior to debugging. For example, you can:
- Copy sources to the target computer and build with dotnet build on the Linux machine.
- Build the app on Windows, and then transfer the build artifacts to the Linux machine. (The build artifacts consist of the application itself, the portable PDBs, any runtime libraries it might depend on, and the .deps.json file.)
When the app is deployed, start the application.
Attach the debugger
When the application is running on the Linux machine, you are ready to attach the debugger.
- In Visual Studio, choose Debug >Attach to Process….
- In the Connection Type list, select SSH.
- Change the Connection Target to the IP address or host name of the target computer. If you haven’t already provided credentials, you will be prompted to enter a password and/or private key file. There are no port requirements to configure, except the port that the SSH server is running on.
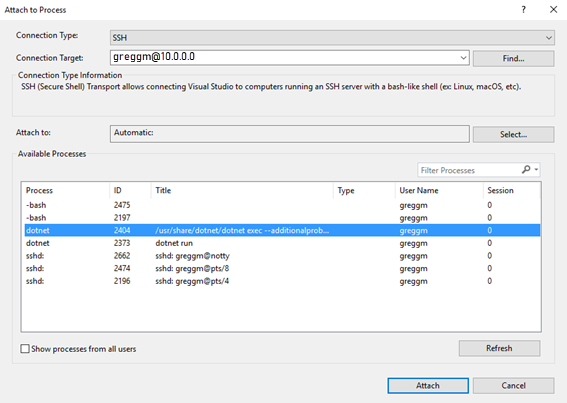
- Find the process that you would like to debug. Your code runs either in a unique process name or a process named dotnet. To find the process that you’re interested in, check the Title column, which shows the command line arguments for the process. In the following example, you see a list of processes from a remote Linux machine over an SSH transport displayed in the Attach to Process dialog box.
- Choose Attach.
- In the dialog that appears, select the type of code you would like to debug. Choose Managed (.NET Core for Unix).
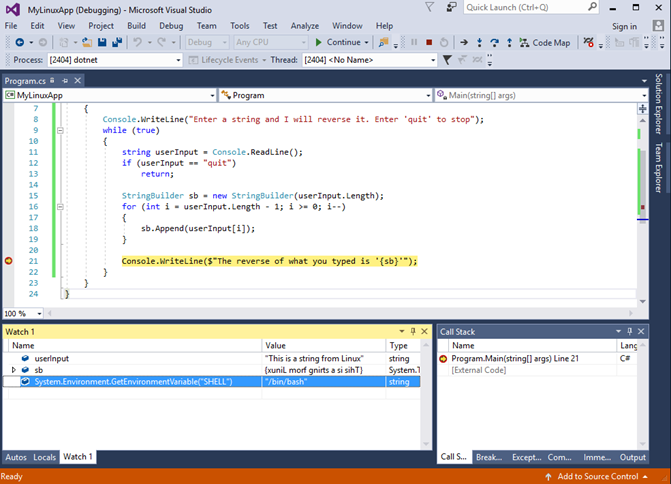
- Use Visual Studio debugging features to debug the app. In the following example, you see the Visual Studio debugger stopped at a breakpoint in code running on a remote Linux machine.
Feedback
Submit and view feedback for