- 5 инструментов с графическим интерфейсом для мониторинга и устранения неполадок вашей Linux-системы
- 1. CPU-X
- 2. Hardinfo
- 3. Nutty
- 4. Stacer
- 5. Ksystemlog
- Best System Monitoring Tools for Ubuntu
- 1. htop
- 2. Glances
- 3. Stacer
- 4. BashTOP
- 5. GNOME System Monitor
- 6. vtop
- 7. nmon
- 8. atop
- 9. gotop
- Conclusion
- About the author
- Swapnil Tirthakar
5 инструментов с графическим интерфейсом для мониторинга и устранения неполадок вашей Linux-системы
Командная строка стала настоящим подспорьем для многих пользователей Linux, которые обращаются к ней как к основному инструменту, когда им необходимо собрать информацию или устранить неполадки в системе. И действительно это невероятно мощный инструмент!
Однако, что вам использовать, если вы новичок в Linux или просто не обладаете навыками и уверенностью в использовании командной строки?
К счастью, это не проблема. В Linux есть ряд приложений с графическим интерфейсом, которые могут быть использованы в качестве альтернативы CLI-инструментам для управления и поддержки вашей системы.
Это статья рассматривает 5 приложений, которые я нашел, но я уверен, что их гораздо больше.
1. CPU-X
CPU-X — это бесплатное программное обеспечение, которое собирает информацию о процессоре, материнской плате и многом другом.
CPU-X похож на CPU-Z lдля Windows, но CPU-X — это свободное программное обеспечение с открытым исходным кодом, разработанное для GNU/Linux.
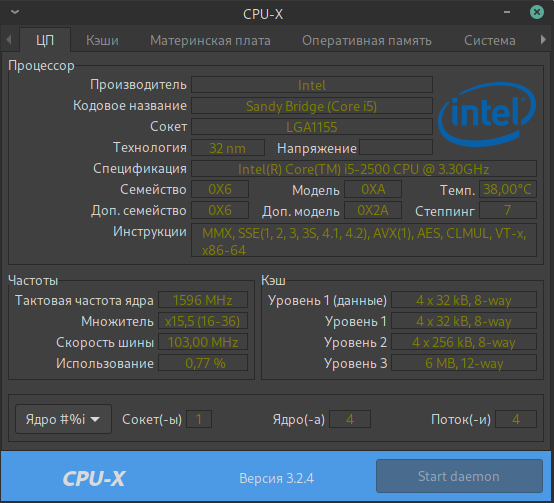

Стоит отметит, что CPU-X способен отображать информацию о параметрах оперативной памяти, припаянной на материнской плате, о чем не может сообщить даже CPU-Z для Windows
CPU-X предоставляет информацию о:
Свежий релиз можно скачать здесь либо установить из репозитория своего дистрибутива.
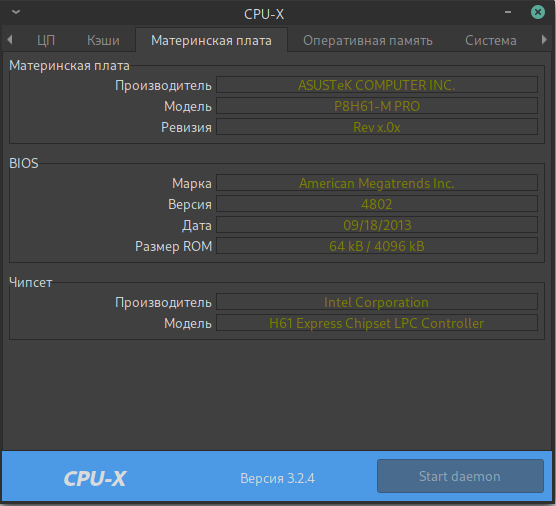
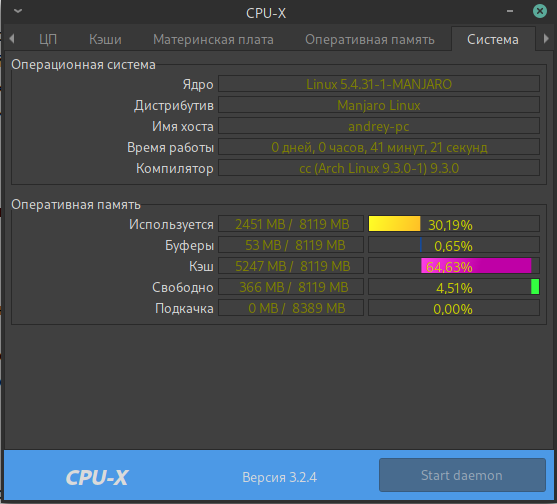
2. Hardinfo
Hardinfo — это приложение, которое может получить полную информацию о вашем компьютере. Hardinfo является свободной альтернативой AIDA64, ничем не уступая последнему по возможностям.
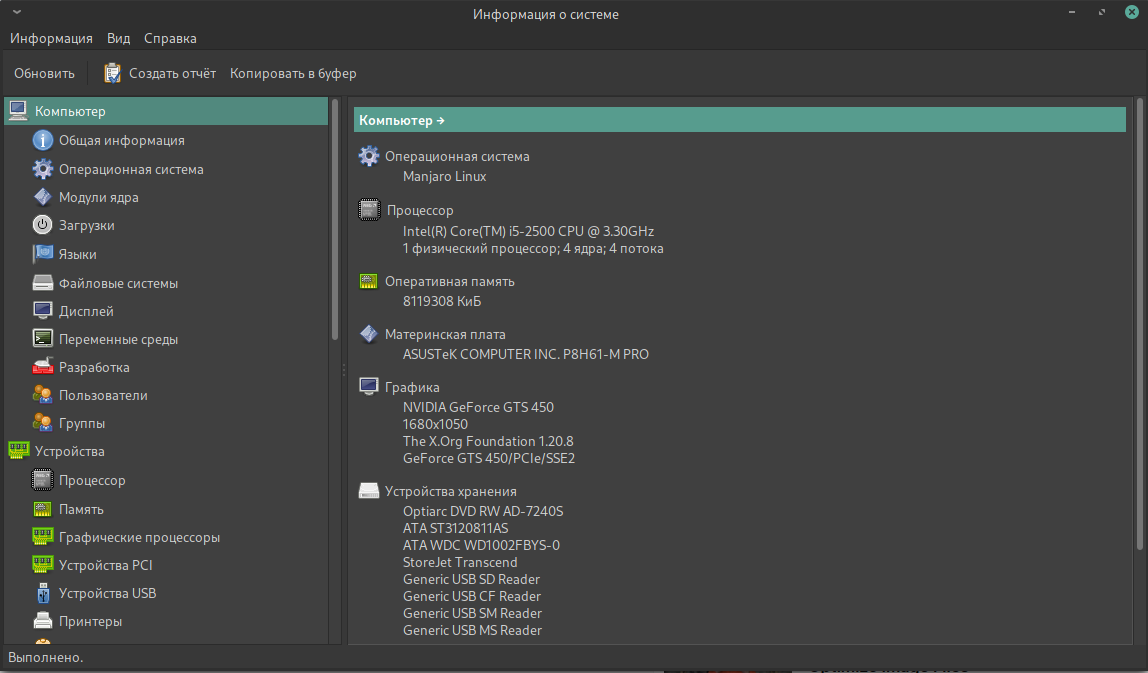
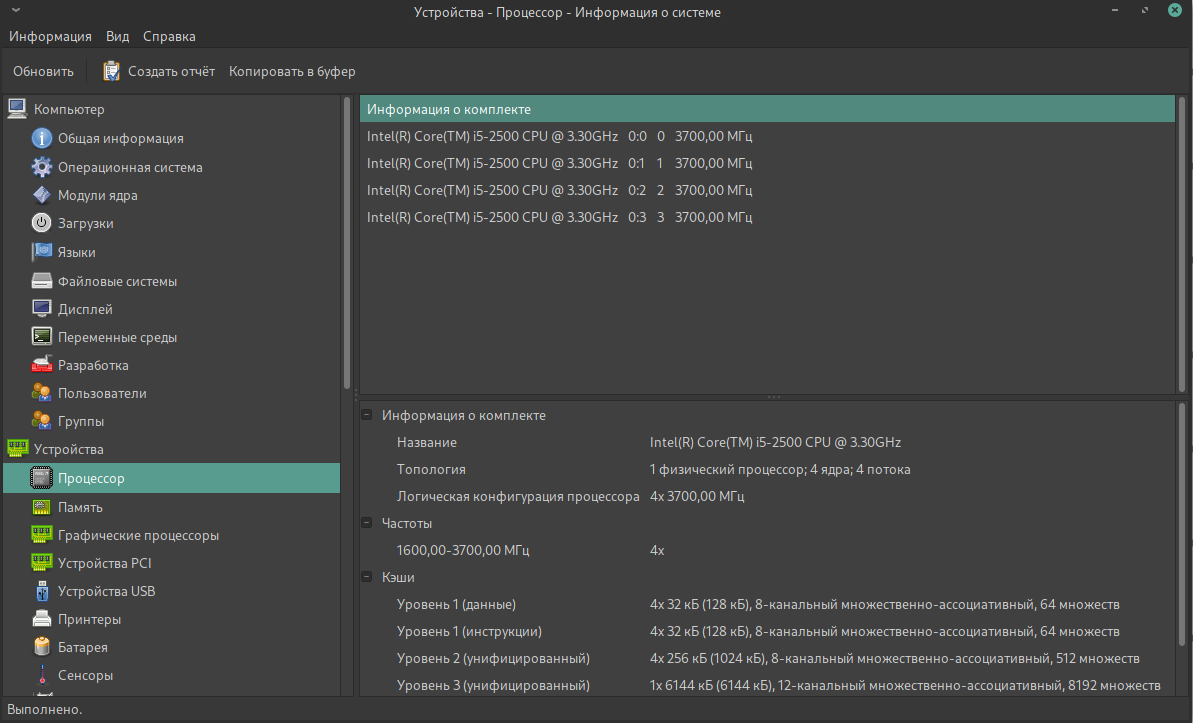
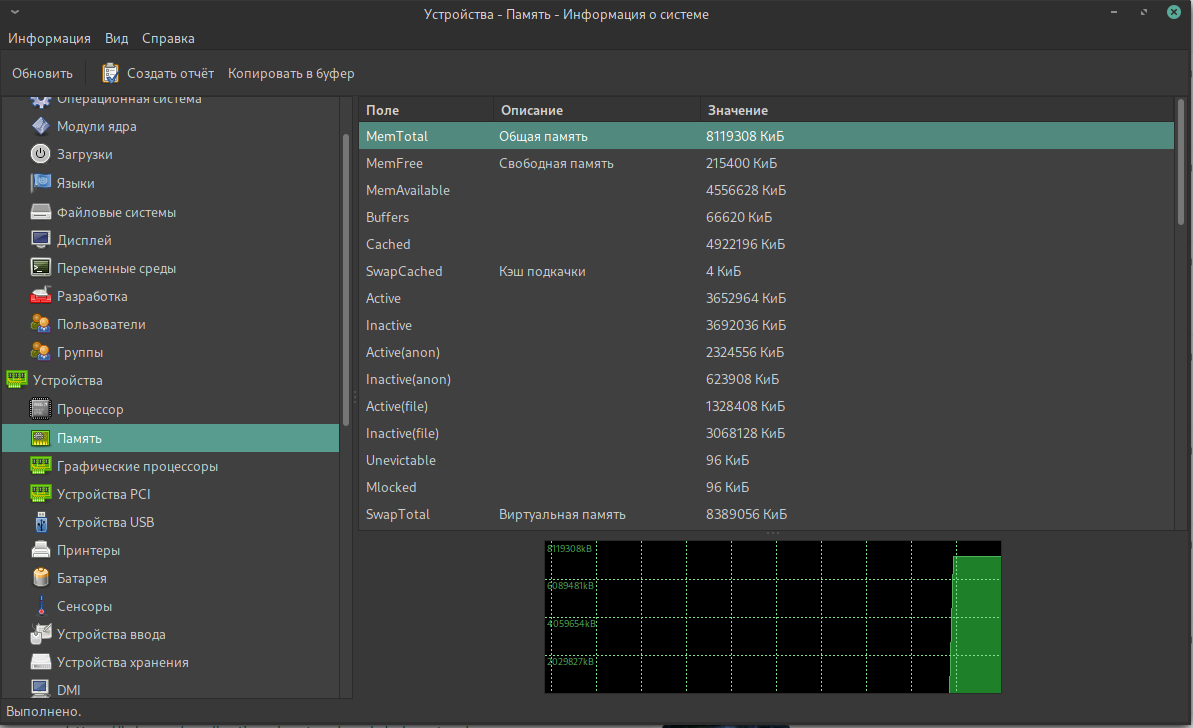
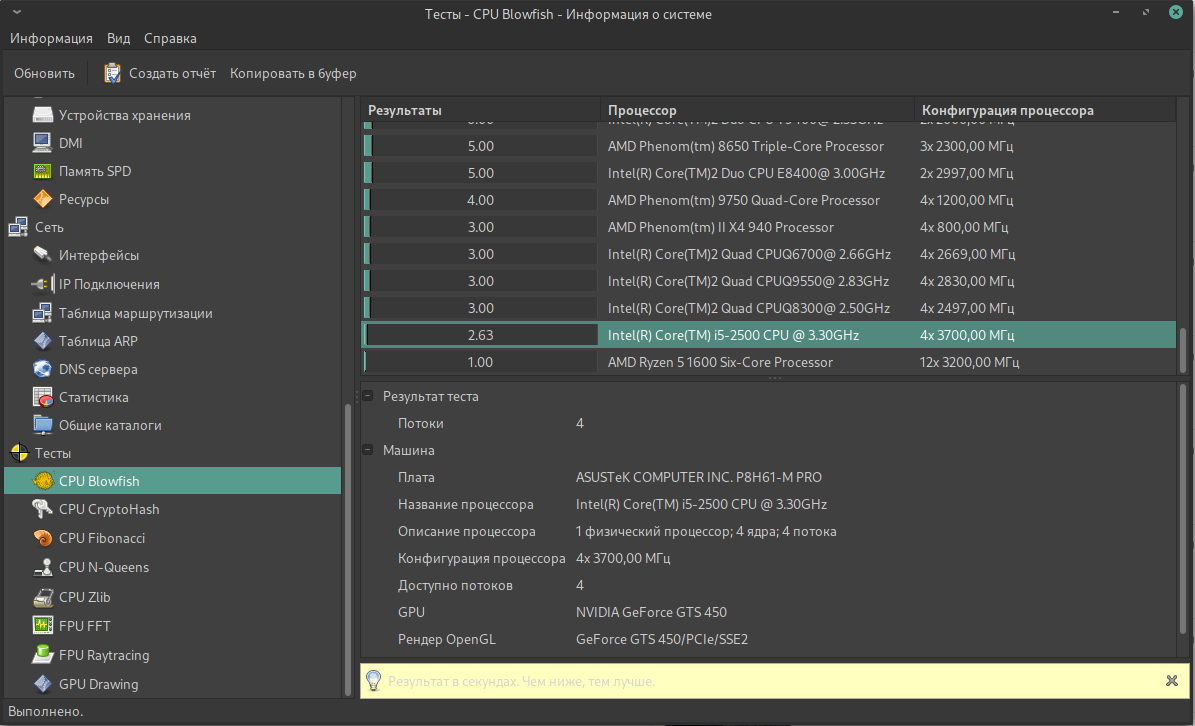
Hardinfo имеет простой графический интерфейс, в котором, пожалуй, любой разберется. Кроме того, что Hardinfo отображает список устройств и имеет возможность оценить их производительность.
Кроме того Hardinfo позволяет:
Свежий релиз можно установить из репозитория своего дистрибутива.
3. Nutty
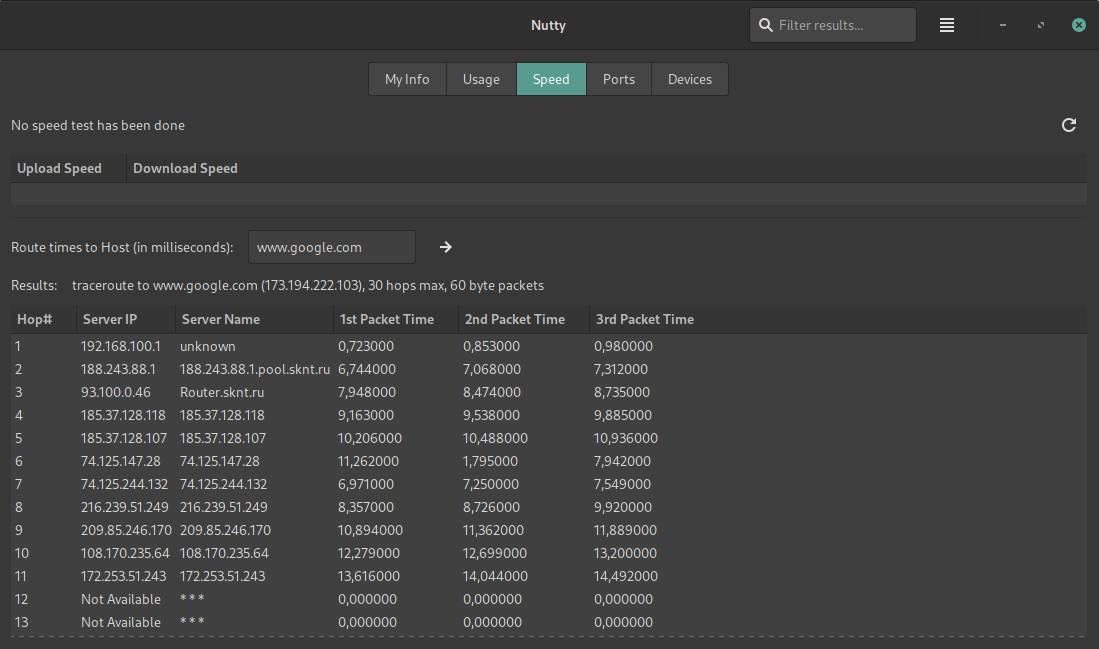
Nutty — это графический инструмент сетевой информации и мониторинга. Приложение может отображать информацию о сетевой карте, использовании сети и данных, тестировать скорость загрузки и скачивания, предоставлять информацию об активных портах и многое другое.
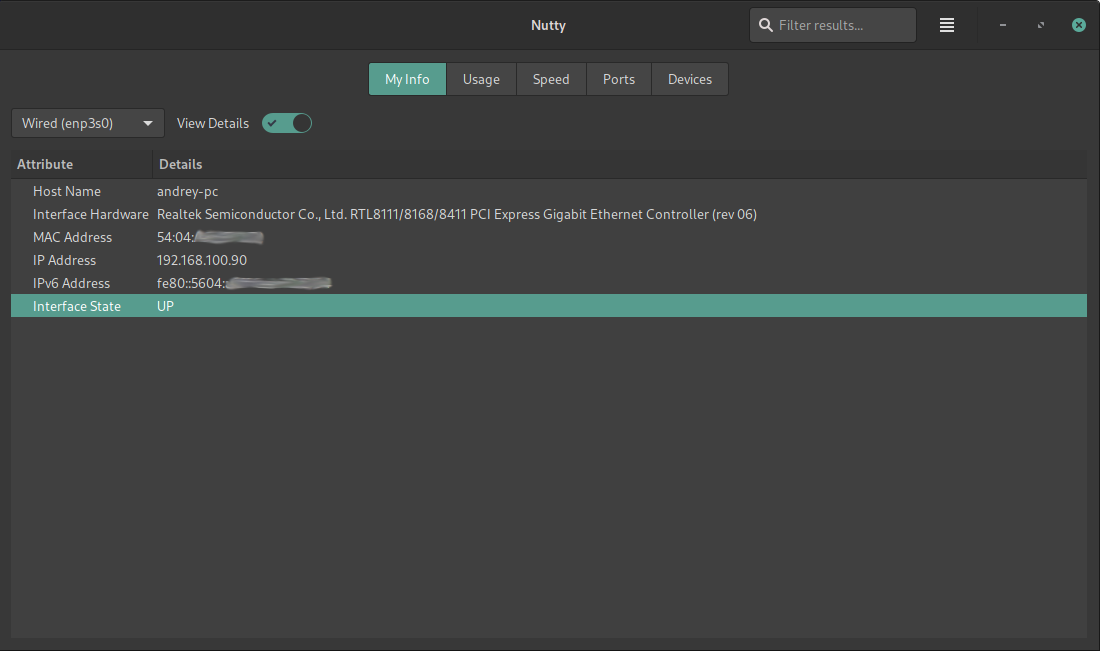

Хотя Nutty сделано для elementary OS , оно также работает на Ubuntu и Linux Mint (также существуют пакеты для openSUSE и Arch Linux). Информация, которую он отображает, поступает от различных инструментов и пакетов, таких как net-tools, nmap, traceroute, vnstat, nethogs, wireless-tools, iproute2 и pciutils.
Приложение имеет несколько жестко закодированных команд для дистрибутивов Linux на базе Ubuntu и, как следствие, некоторые его возможности могут не работать на других дистрибутивах Linux. Тем не менее, существует работа по экстернализации всех команд из кода, чтобы облегчить работу с другими дистрибутивами Linux.
Вкладка Usage: данные об использовании сети за прошлые периоды (данные отправленные, полученные и общие переданные данные за этот месяц, за вчера и за сегодня ) и текущее использование, а также текущее приложение, использующее выбранное соединение, и размер переданных данных.
Вкладка Speed: запускает проверку скорости загрузки/выгрузки (с помощью speedtest.net), и получает время маршрута к хосту (traceroute)
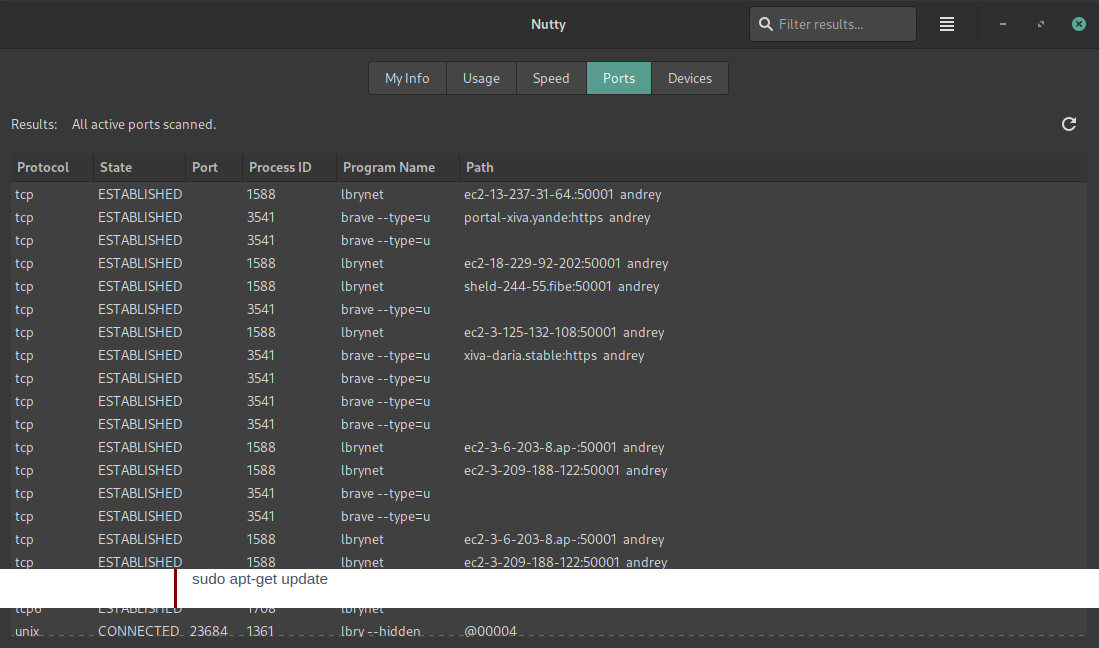
Вкладка Ports: отображает активные порты и используемые приложения (порт, идентификатор процесса, имя программы и путь).
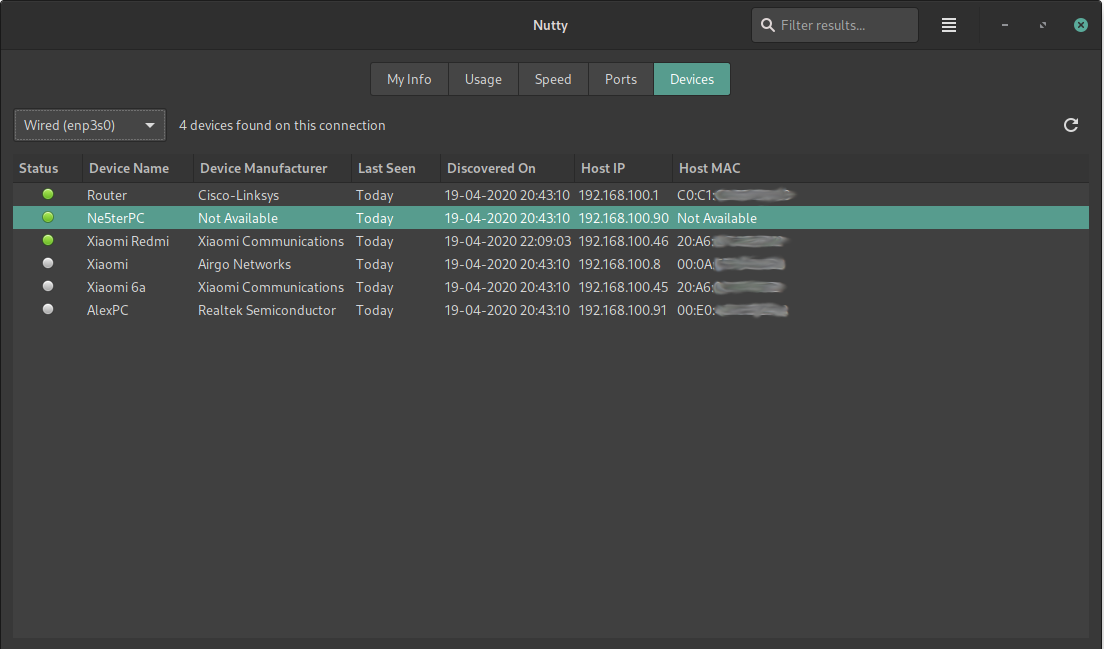
Вкладка Devices: сканирует другие устройства в сети и позволяет редактировать их имена, чтобы сделать их более узнаваемыми.
Фоновый мониторинг устройства: с помощью настроек Nutty вы можете включить мониторинг устройств через заданные промежутки времени. Это позволяет Nutty запускать и сканировать устройства, показывая уведомление на рабочем столе, когда новое устройство в сети найдено.
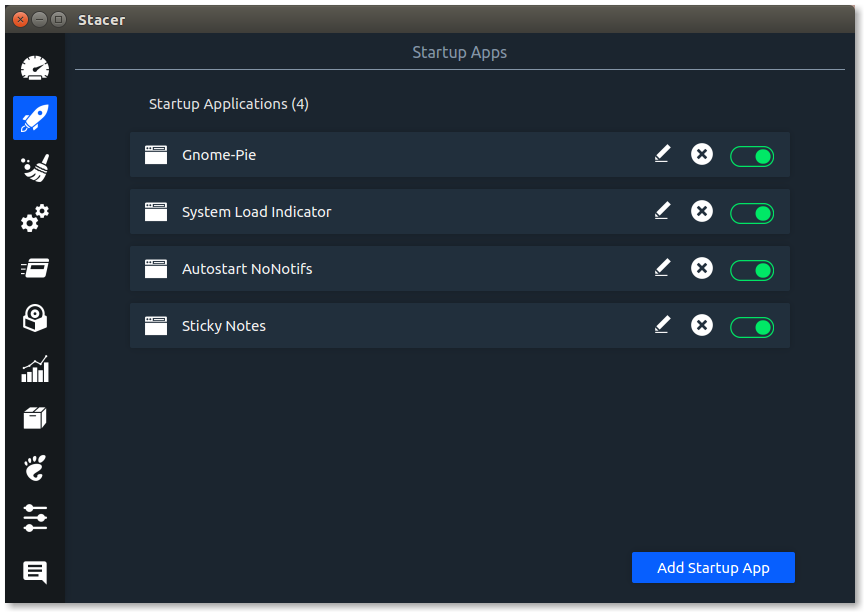
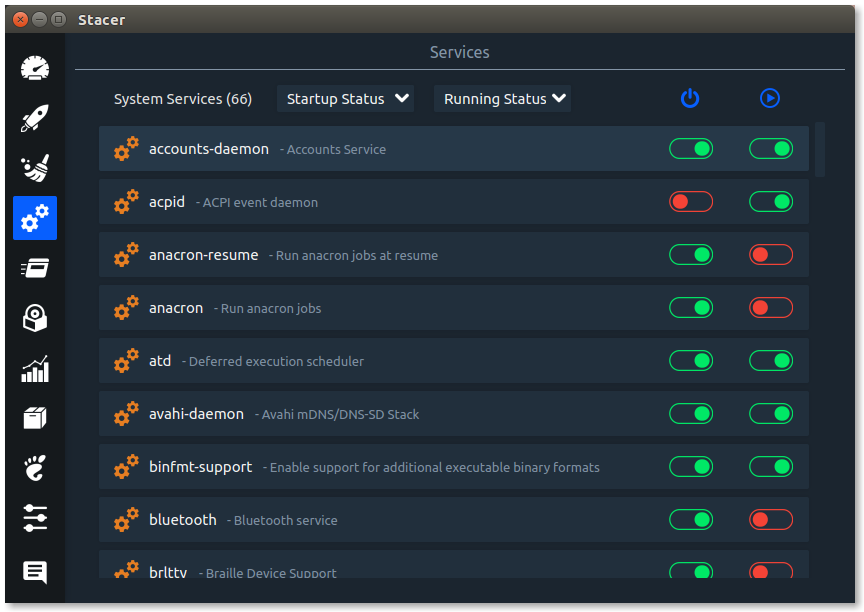
4. Stacer
Stacer это оптимизатор системы с открытым исходным кодом для Ubuntu, который построен с использованием Framework Electron.
Эта утилита поможет вам в отслеживании ваших системных ресурсов, очистить кэш-память приложений, удалить ненужные программы, и даже контролировать системные процессы, которые запускаются в фоновом режиме.

5. Ksystemlog
KSystemLog — это инструмент просмотра системного журнала для KDE.
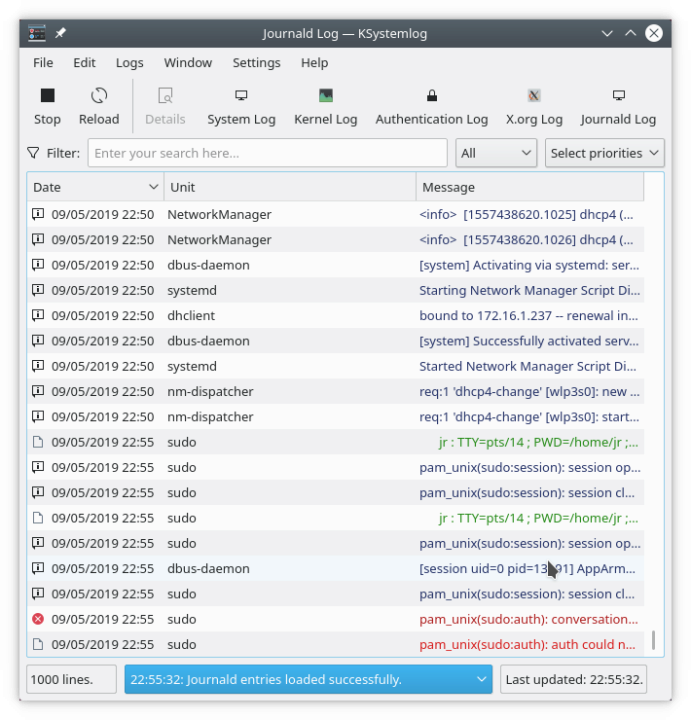
KSystemLog помогает пользователям понять, что делает их машина в фоновом режиме. Этот пакет предназначен для упрощения чтения файлов системного журнала, и разработан для новичков, которые не знают, как найти информацию о своей системе или где находятся файлы журналов на их компьютере. KSystemLog также предоставляет возможности для простой сортировки и фильтрации строк системного журнала.
Тем не менее, программа полезна для опытных пользователей, которые хотят быстро увидеть проблемы, возникающие на их сервере. KSystemLog пытается предоставить некоторые расширенные возможности, чтобы позволить сортировку и чтение журналов из определённых программ.
Этот пакет является частью модуля администрирования KDE.
Включают в себя следующие возможности:
Показ всех журналов системы, сгруппированные по общим (Системный лог по умолчанию, аутентификация, ядро, X.org…) и дополнительным сервисам (Apache, Cups,…).
Best System Monitoring Tools for Ubuntu
![]()
It does not matter if you’re a system administrator or an average user, but keeping your computer infrastructure and network running smoothly is very important. Hence, you need a reliable system monitoring tool that will help you keep track of all the system activities like CPU performance, memory usage, network monitoring, and status of all the connected devices.
There are many choices available on the internet for system monitoring tools. Still, we have crafted a list of the best system monitoring tools for you by testing each tool in different circumstances. So, sit back and enjoy the ride to find the best system monitoring tool for Ubuntu that matches your requirements.
1. htop
htop is a cross-platform system monitor, process viewer, and process manager and a reliable alternative to top, which is also a system monitoring tool for Linux and its distros. It is specially designed and developed for consoles and terminals; hence, it supports text mode.
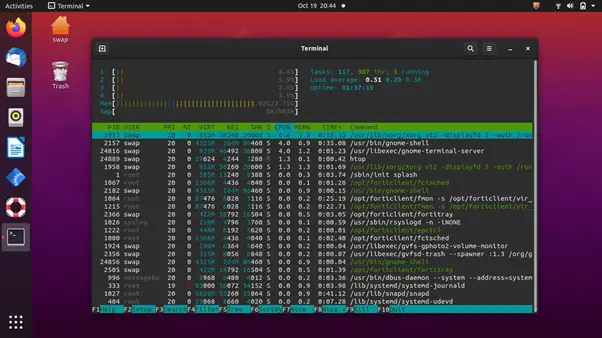
It is a feature-rich system monitoring tool that can be used on Linux, FreeBSD, OpenBSD, and macOS. Talking about the features, it offers information based on various parameters, such as tasks, load average, and uptime. You can change color preferences on its UI to match your requirements.
For Linux and its distros, it provides a delay account matrix and offers support for custom scripts and real-time signals. Since it is open-source and free, it makes it one of the best system monitoring tools for Linux systems.
2. Glances
Written in Python, Glances is another cross-platform system monitoring tool on our list. It uses a web-based interface to give you maximum system information in the minimum possible space. Depending on terminal size, it automatically adjusts itself and displays all the information in a single window.
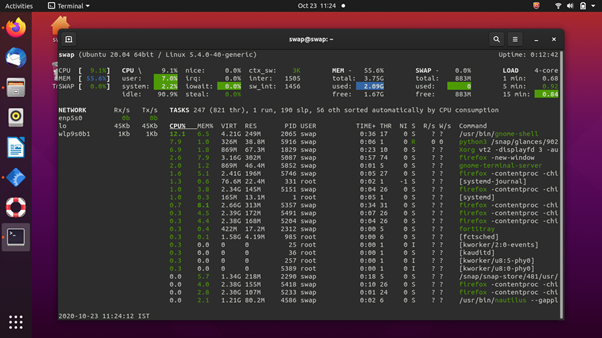
It can also be used in client/server mode, and remote system monitoring could be done through the web interface or terminal. You getting all the important information in one place is one of the positives of this tool.
The thing I like most about this system monitoring tool is that you can keep track using its web interface, which allows remote monitoring. Linux running on low-end or older computers might find it tough to run this tool smoothly as it demands higher CPU resources.
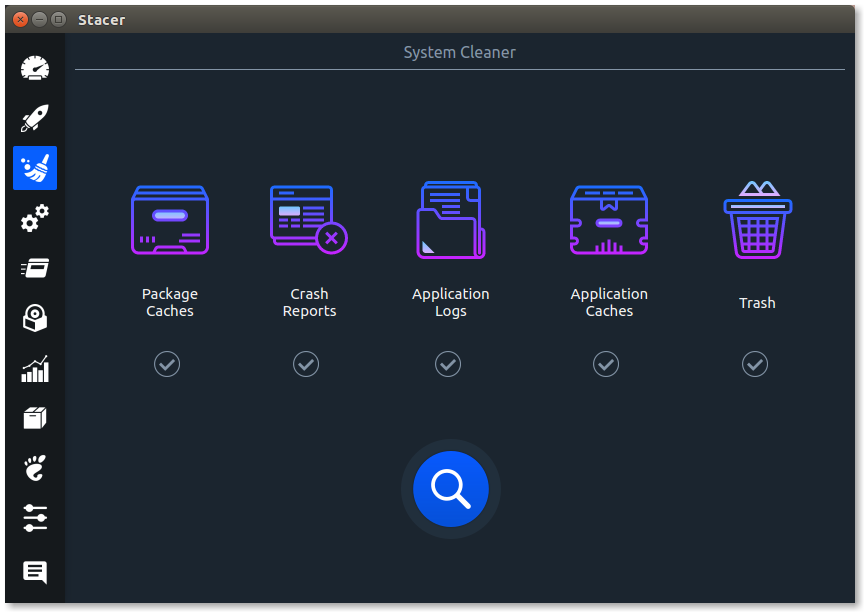
3. Stacer
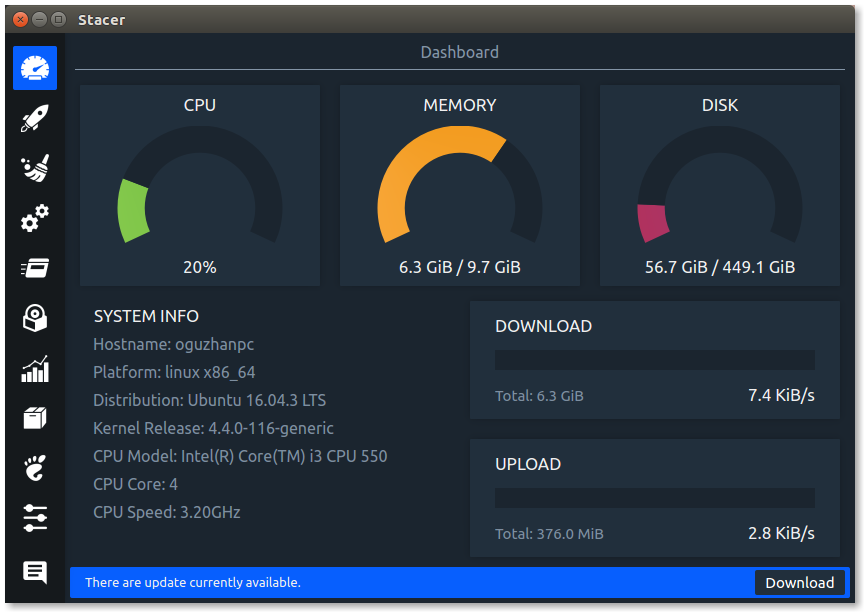
Stacer is an open-source system monitor and optimization tool, which helps system administrators manage system resources and tasks under one roof. It is a modern tool with an excellent user interface that makes you feel at home even on first use.
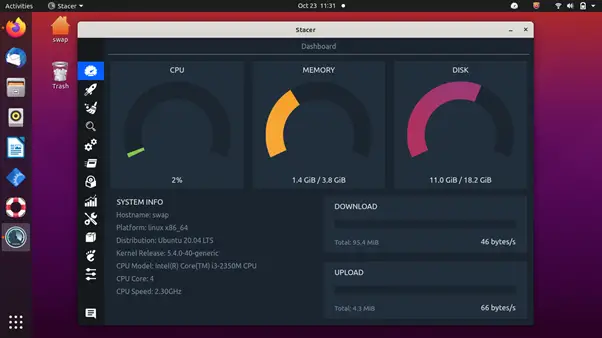
It has feature-rich tools that let you manage startup apps, clean unnecessary package caches, crash reports, application logs, application caches, and trash under the system cleaner tab, and start or stop services quickly. Sort processes based on process id (PID), CPU, and memory usage, find a particular process easily using its name in the search bar, and uninstall applications that are not required anymore.
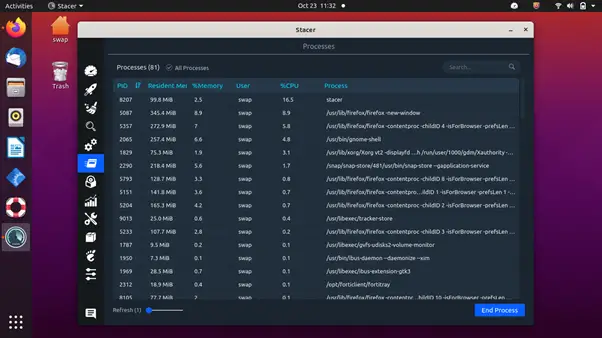
The resource tab displays CPU, RAM, Disk, CPU load average, and network activity for the last 60 seconds. It also comes with an APT repository manager, which you can use to activate, disable or delete any repository. Ubuntu users can use this feature to edit the package repositories.
Sudo add-apt-repository ppa:oguzhaninan / stacer
sudo apt-get install stacer
4. BashTOP
BashTOP is another cool and reliable system monitoring tool for Linux and its distros, such as Ubuntu. It displays the usage stats for processors, memory, disks, network, and other resources.
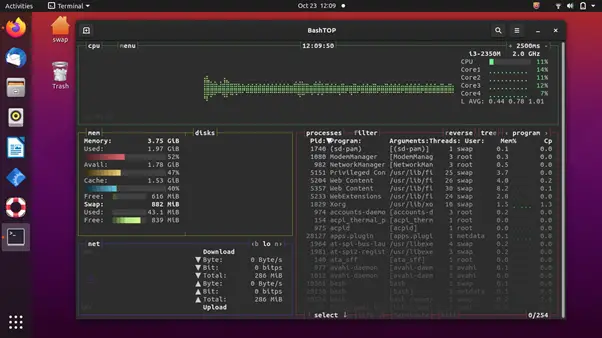
It is an excellent tool for desktop and computer users who are generally personal users. However, system administrators and server users won’t find this tool useful as their demands will be higher. Also, it is a little bit slower compared to other system monitoring tools, such as Htop.
It is an easy-to-use tool and sports a beautiful user interface with everything placed perfectly.
$ sudo add-apt-repository ppa:bashtop-monitor / bashtop
5. GNOME System Monitor
It is a simple system monitoring tool that comes pre-installed on various Linux distros running the GNOME desktop environment. This tool shows which programs are running, how much processor time, memory, and disk space are used.
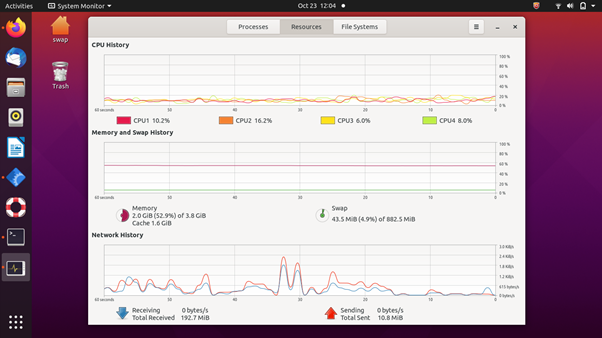
As you can see in the screenshot, it has a clean and simple user interface. Every information and stats are placed perfectly in the user interface, which makes it easy to read and understand.
The CPU history tab shows how much processor capacity is used for each CPU, and the memory and history tabs show how much of your computer’s memory (RAM) is being used. Under the network tab, you see the download and upload speed of the network over the last 60 seconds.
6. vtop
vtop is a free and open-source system monitoring tool for Ubuntu and other Linux distros. Using vtop, not only can you monitor system resources, but also you can manage them.
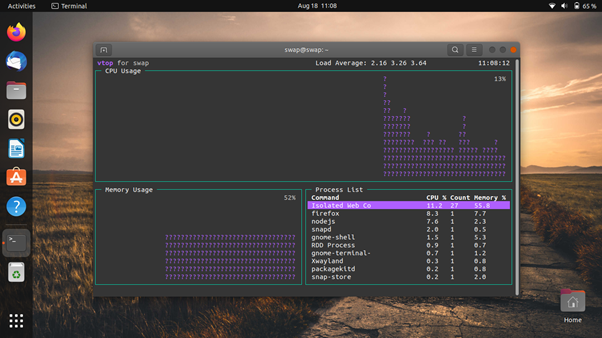
It is a command-line tool written in node.js. Hence, you must first install node.js and npm packages before installing vtop. Using this tool, you can easily monitor CPU usage and memory usage, something you can do in other command-line tools like top.
$ sudo apt-get install node.js
7. nmon
nmon is a simple-to-use system monitoring tool for Linux and its distros, such as Ubuntu. It gives you a quick overview of what’s going on with your server.
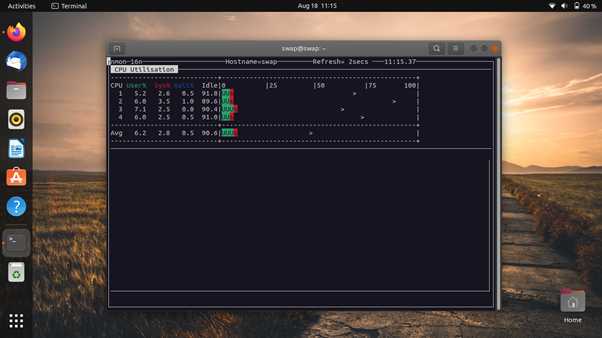
This monitoring tool displays the usage stats of CPU, memory, network, disks, file system, NFS, top processes, and resources. The best thing is you can select what the nmon displays, and what you have to do is simply press specific keys to toggle stats.
8. atop
atop is an advanced interactive system and process monitor that displays the load on the Linux system. It shows the stats of the most critical hardware resources, such as CPU, memory, disk, and network.
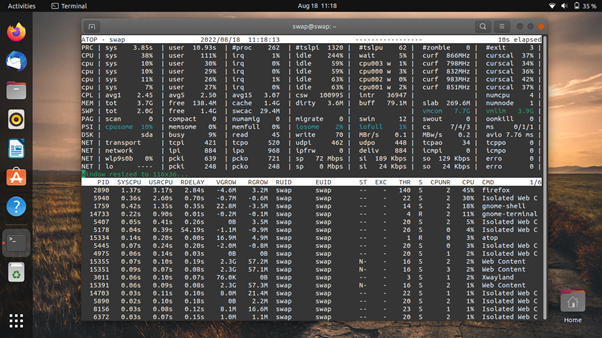
You can log resource utilization permanently if you want it for long-term analysis.
9. gotop
gotop is another command-line graphical system monitoring tool for Ubuntu and other Linux distros. Along with Linux, gotop is also available for macOS.
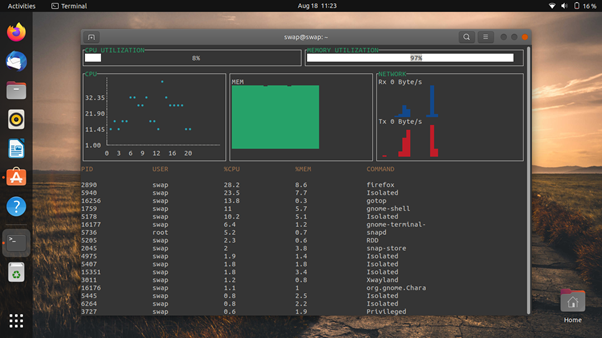
It is inspired by vtop and gtop. But unlike them, it does not use node.js. Instead, it is written in Go. You can monitor CPU usage, disk usage, CPU temperature, memory usage, network usage, and process table.
Conclusion
These are the best system monitoring tools you can use on your computers running Linux and its distros. Some other tools are available for Ubuntu, but the ones listed above are tested and presented to you.
About the author
Swapnil Tirthakar
A Software Engineer who loves football and passionate about traveling. I often spend my free time playing with gadgets and exploring new possibilities in tech world. I am Linux enthusiast and have about 6 years of experience in web development. I have good command on Python, Java, SQL and system security.