- Install Perf Tool in Linux
- How to install
- check kernel version
- check perf version
- Install perf tool
- case1 (for system 1)
- case 2 (for system 2)
- Basic usuage
- Perf- A Performance Monitoring and Analysis Tool for Linux
- Introducing and installing Perf in Linux
- Subcommands
- Perf list
- Perf stat
- Perf top
- Perf record
- Perf report
- Summary
- What is Perf?#
- Install on Ubuntu#
- Perf with GUI#
Install Perf Tool in Linux
Perf is a profiler tool for Linux based system which can be used to measure system performance. Our recent project requires the usuage of this tool. Mainly installed on regular Linux server and embedded system.
How to install
- system 1: Ubuntu 16.04.5 LTS (GNU/Linux 4.4.0-131-generic x86_64)
- system 2: Ubuntu 16.04.2 LTS (4.4.77)
check kernel version
$uname -r (return: 4.4.0-131-generic in system 1) (or return: 4.4.77 in system 2)
You can also check if perf has been installed in your system by:
check perf version
If you have right one, you will see the version of perf
check if you have ‘linux-tools’ dir. If so, you can $cd linux-tools to see the perf tool dir like ‘4.4.0-131-generic’. These two ways can be used to check after you install the perf tool.
Install perf tool
case1 (for system 1)
If you don’t have perf on the system, easiest way you can do is:
$sudo apt-get install linux-tools-common linux-tools-generic linux-tools-`uname -r`
or $sudo apt-get install linux-tools-common linux-tools-generic
If you kernel version and linux-tool-generic version are same, you may be done here. However, most of time, the current update version may not be the same as what required. When you check $perf —version , you may get WARNING: perf not found for kernel and you may need to install the following packages for this specific kernel: … ,where the right version is required.
You can check if you have the right version as warning list by:
$sudo apt-cache search linux-tools
If not, you can go to search the packages required online, like what I needed for my system is the package linux-tools-4.4.0-131-generic, which I found here, select your architecture type and followed the instruction. You may need to add new mirror site which contained the package required to your apt source list.
$vi sources.list (add sudo if permission denied)
in sources.list add one line: deb mirrors.kernel.org/ubuntu trusty-updates main
After you update the sources list and you can install the pacakage.
$sudo apt-get install linux-tools-4.4.0-131-generic
Then you can check the perf version perf —version and you can see the perf tool version without asking to install pacakge and you are all set. You can use your pert tool now.
case 2 (for system 2)
Wait, that is not the end. If returning result of $uname -r is like this 4.4.77 , the previous way may not work. If you do $sudo apt-get install linux-tools-4.4.77 but cannot get the tool installed. In this case, download the required linux kernel version (our case is v4.4.77) and go to ‘linux->tools->perf’ to install it.
$git clone git://git.kernel.org/pub/scm/linux/kernel/git/stable/linux-stable.git
$git checkout v4.4.77 (you can also check your git status git status )
$make (If error came and asked for installation of ‘flex’ and ‘bison’, $sudo apt-get install flex and $sudo apt-get install bison )
After doing this, you can try $perf —version and hope it works for you now.
After make , you can also try make install and then check the perf —version .
Basic usuage
$perf stat -e cache-misses ./test (./test is your executable file) -cache miss
$perf record -e cache-misses ./test
when run perf record -e cache-misses ./test , you may come with error or warning like this and cannot get perf report:
WARNING: Kernel address maps (/proc/) are restricted, check /proc/sys/kernel/kptr_restrict.
You can check the kptr_restrict value is 1 and it is read-only file, what you can do is like this:
echo 0 | sudo tee /proc/sys/kernel/kptr_restrict
You can check the value in kptr_restrict has been changed from 1 to 0.
Now you can run $perf record -e cache-misses ./test and get the perf report then.
More tutorials about perf tool can be found on perf wiki
You may also check another useful Perf-tools on github.
Others: tried the same steps in container, however, cannot do the same perf operations in container.
jovyan@7eeaf145b774:~/work$ perf stat -e cache-misses ./test Error: You may not have permission to collect stats. Consider tweaking /proc/sys/kernel/perf_event_paranoid: -1 - Not paranoid at all 0 - Disallow raw tracepoint access for unpriv 1 - Disallow cpu events for unpriv 2 - Disallow kernel profiling for unpriv [References]
This work is licensed under a Attribution-NonCommercial 4.0 International license.
Perf- A Performance Monitoring and Analysis Tool for Linux
When we talk of performance in computing, we refer to the relationship between our resources and the tasks that they allows us to complete in a given period of time.
In a day of fierceless competition between companies, it is important that we learn how to use what we have at the best of its capacity. The waste of hardware or software resources, or the lack of ability to know how to use them more efficiently, ends up being a loss that we just can’t afford if we want to be at the top of our game.
At the same time, we must be careful to not take our resources to a limit where sustained use will yield irreparable damage.
In this article we will introduce you to a relatively new performance analysis tool and provide tips that you can use to monitor your Linux systems, including hardware and applications. This will help you to ensure that they operate so that you are capable to produce the desired results without wasting resources or your own energy.
Introducing and installing Perf in Linux
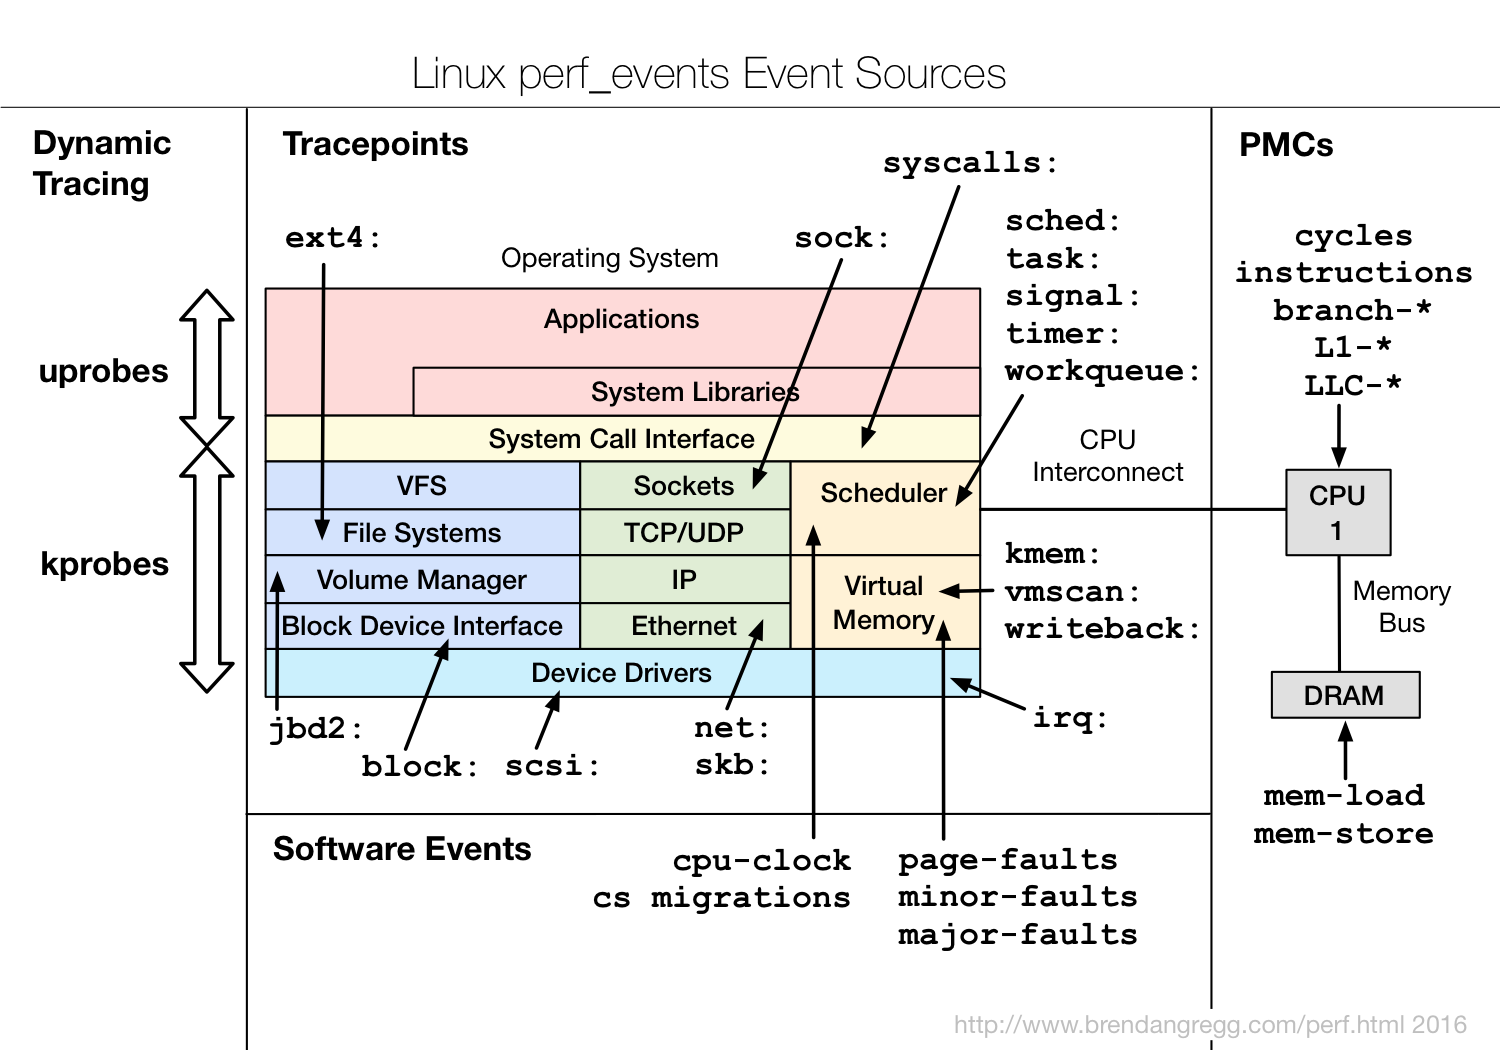
Among others, Linux provides a performance monitoring and analysis tool called conveniently perf. So what distinguishes perf from other well-known tools with which you are already familiar?
The answer is that perf provides access to the Performance Monitoring Unit in the CPU, and thus allows us to have a close look at the behavior of the hardware and its associated events.
In addition, it can also monitor software events, and create reports out of the data that is collected.
You can install perf in RPM-based distributions with:
# yum update && yum install perf [CentOS / RHEL / Fedora] # dnf update && dnf install perf [Fedora 23+ releases]
In Debian and derivatives:
# sudo aptitude update && sudo aptitude install linux-tools-$(uname -r) linux-tools-generic
If uname -r in the command above returns extra strings besides the actual version (3.2.0-23-generic in my case), you may have to type linux-tools-3.2.0-23 instead of using the output of uname.
It is also important to note that perf yields incomplete results when run in a guest on top of VirtualBox or VMWare as they do not allow access to hardware counters as other virtualization technologies (such as KVM or XEN) do.
Additionally, keep in mind that some perf commands may be restricted to root by default, which can be disabled (until the system is rebooted) by doing:
# echo 0 > /proc/sys/kernel/perf_event_paranoid
If you need to disable paranoid mode permanently, update the following setting in /etc/sysctl.conf file.
kernel.perf_event_paranoid = 0
Subcommands
Once you have installed perf, you can refer to its man page for a list of available subcommands (you can think of subcommands as special options that open a specific window into the system). For best and more complete results, use perf either as root or through sudo.
Perf list
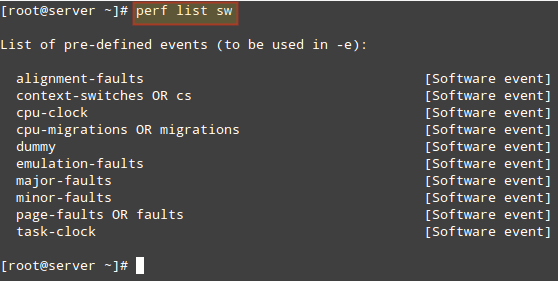
perf list (without options) returns all the symbolic event types (long list). If you want to view the list of events available in a specific category, use perf list followed by the category name ([hw|sw|cache|tracepoint|pmu|event_glob]), such as:
Display list of software pre-defined events in Linux:
Perf stat
perf stat runs a command and collects Linux performance statistics during the execution of such command. What happens in our system when we run dd?
# perf stat dd if=/dev/zero of=test.iso bs=10M count=1
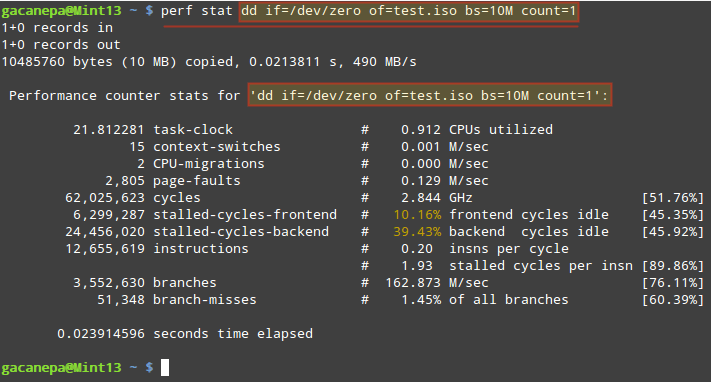
The stats shown above indicate, among other things:
- The execution of the dd command took 21.812281 milliseconds of CPU. If we divide this number by the “seconds time elapsed” value below (23.914596 milliseconds), it yields 0.912 (CPU utilized).
- While the command was executed, 15 context-switches (also known as process switches) indicate that the CPUs were switched 15 times from one process (or thread) to another.
- 2 CPU migrations is the expected result when in a 2-core CPU the workload is distributed evenly between the number of cores.
During that time (21.812281 milliseconds), the total number of CPU cycles that were consumed was 62,025,623, which divided by 0.021812281 seconds gives 2.843 GHz. - If we divide the number of cycles by the total instructions count we get 4.9 Cycles Per Instruction, which means each instruction took almost 5 CPU cycles to complete (on average). We can blame this (at least in part) on the number of branches and branch-misses (see below), which end up wasting or misusing CPU cycles.
- As the command was executed, a total of 3,552,630 branches were encountered. This is the CPU-level representation of decision points and loops in the code. The more branches, the lower the performance. To compensate for this, all modern CPUs attempt to predict the flow the code will take. 51,348 branch-misses indicate the prediction feature was wrong 1.45% of the time.
The same principle applies to gathering stats (or in other words, profiling) while an application is running. Simply launch the desired application and after a reasonable period of time (which is up to you) close it, and perf will display the stats in the screen. By analyzing those stats you can identify potential problems.
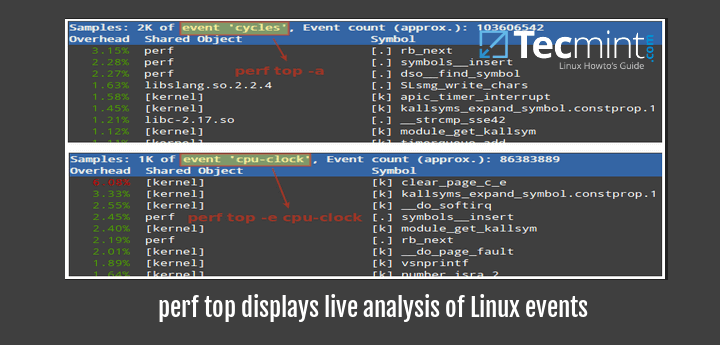
Perf top
perf top is similar to top command, in that it displays an almost real-time system profile (also known as live analysis).
With the -a option you will display all of the known event types, whereas the -e option will allow you to choose a specific event category (as returned by perf list):
Will display all cycles event.
Will display all cpu-clock related events.
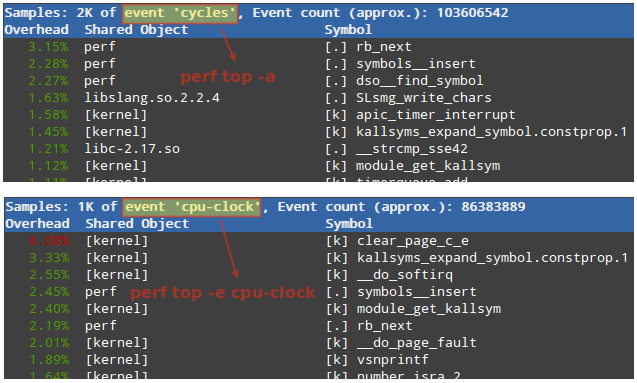
The first column in the output above represents the percentage of samples taken since the beginning of the run, grouped by function Symbol and Shared Object. More options are available in man perf-top.
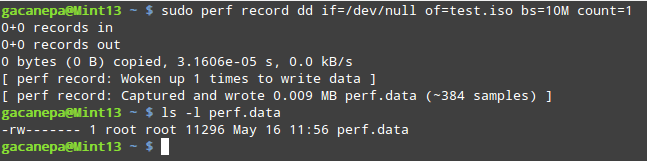
Perf record
perf record runs a command and saves the statistical data into a file named perf.data inside the current working directory. It runs similarly to perf stat.
Type perf record followed by a command:
# perf record dd if=/dev/null of=test.iso bs=10M count=1
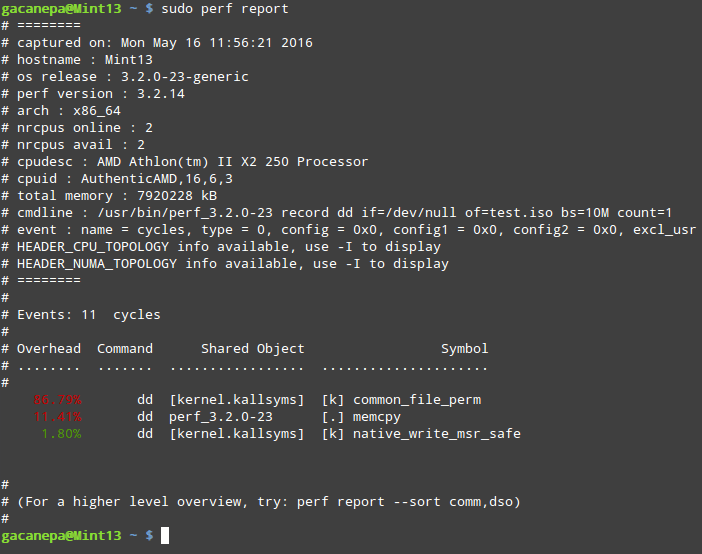
Perf report
perf report formats the data collected in perf.data above into a performance report:
All of the above subcommands have a dedicated man page that can be invoked as:
where subcommand is either list, stat, top, record, or report. These are the most frequently used subcommands; others are listed in the documentation (refer to the Summary section for the link).
Summary
In this guide we have introduced you to perf, a performance monitoring and analysis tool for Linux. We highly encourage you to become familiar with its documentation which is maintained in https://perf.wiki.kernel.org.
If you find applications that are consuming a high percentage of resources, you may consider modifying the source code, or use other alternatives.
If you have questions about this article or suggestions to improve, we are all ears. Feel free to reach us using the comment form below.
What is Perf?#
Perf or perf-event is a Linux profiler and is part of the Linux Kernel which can help you solve advanced performance and troubleshooting functions. It covers hardware level (CPU/PMU, Performance Monitoring Unit) features and software features (software counters, tracepoints) as well.
Install on Ubuntu#
If perf has not installed on the system
$ perf WARNING: perf not found for kernel 5.4.0-109 You may need to install the following packages for this specific kernel: linux-tools-5.4.0-109-generic linux-cloud-tools-5.4.0-109-generic You may also want to install one of the following packages to keep up to date: linux-tools-generic linux-cloud-tools-generic $ The perf is part of linux-tools-generic package on Ubuntu:
$ sudo apt install linux-tools-generic The following additional packages will be installed: linux-tools-5.4.0-109 linux-tools-5.4.0-109-generic The following NEW packages will be installed: linux-tools-5.4.0-109 linux-tools-5.4.0-109-generic linux-tools-generic 0 upgraded, 3 newly installed, 0 to remove and 0 not upgraded. Need to get 5,597 kB of archives. After this operation, 25.9 MB of additional disk space will be used. Do you want to continue? [Y/n] . $ perf -v perf version 5.4.178 $ There was a warning when running the perf on the terminal
“Cannot load tips.txt file, please install perf!”
Perf with GUI#
hotspot: a standalone GUI for performance data