- HTTP POST benchmarking / stress-testing an API behind HAProxy with siege
- Add a comment
- Comments (newest first)
- Стресс-тест сети (DoS веб-сайта) со SlowHTTPTest в Kali Linux: slowloris, slow body и slow read атаки в одном инструменте
- Установка SlowHTTPTest
- Установка для пользователей Kali Linux
- Для других дистрибутивов Linux
- Mac OS X
- Linux
- Использование SlowHTTPTest
HTTP POST benchmarking / stress-testing an API behind HAProxy with siege
I was looking for a way to stress-test a SOAP API running behind a HAProxy loadbalancer using a HTTP POST. In my usual stress-testing scenarios (using GET) I’ve been using «wrk» and «httperf» for years. But this week I came across something else: siege.
According to the description, siege is:
HTTP regression testing and benchmarking utility
Siege is an regression test and benchmark utility. It can stress test a single
URL with a user defined number of simulated users, or it can read many URLs
into memory and stress them simultaneously. The program reports the total
number of hits recorded, bytes transferred, response time, concurrency, and
return status. Siege supports HTTP/1.0 and 1.1 protocols, the GET and POST
directives, cookies, transaction logging, and basic authentication. Its
features are configurable on a per user basis.
Installation in Debian and Ubuntu is very easy as siege is already part of the standard repositories:
$ sudo apt-get install siege
To run a benchmarking (stress-) test using POST data, I used the following command:
# siege -b —concurrent=10 —content-type=»text/xml;charset=utf-8″ -H «Soapaction: »» ‘http://localhost:18382/ POST < /tmp/xxx' -t 10S
-b: Run a benchmark/stresstest (there are no delays between requests as it would be from a normal Internet user)
—concurrent=n: Simulate n concurrent users, here I chose 10 concurrent users
—content-type: Define the content-type. Can be pretty important when testing a POST (to send data in the correct format)
-H: Several additional HTTP headers can be send by using -H (multiple times)
-t: For how long do you want to run siege? Here I chose 10 seconds.
One has to look out for the destination URL syntax. It must be in single quotes and also contain the request method:
Additionally I directly used the data stored in the file /tmp/xxx to be sent by POST:
$ cat /tmp/xxx
Internet Claudio Kuenzler Hello world This is a test.
This can of course be in any format (for example json) you want, as long as the destination API correctly handles the data.
The siege command above returns statistics after it finished its run:
# siege -b —concurrent=10 —content-type=»text/xml;charset=utf-8″ -H «Soapaction: »» ‘http://localhost:18382/ POST < /tmp/xxx' -t 10S
** SIEGE 3.0.8
** Preparing 10 concurrent users for battle.
The server is now under siege.
Lifting the server siege. done.
Transactions: 224 hits
Availability: 100.00 %
Elapsed time: 9.60 secs
Data transferred: 0.10 MB
Response time: 0.23 secs
Transaction rate: 23.33 trans/sec
Throughput: 0.01 MB/sec
Concurrency: 5.41
Successful transactions: 224
Failed transactions: 0
Longest transaction: 4.91
Shortest transaction: 0.00
FILE: /var/log/siege.log
You can disable this annoying message by editing
the .siegerc file in your home directory; change
the directive ‘show-logfile’ to false.
Most of them are pretty safe explanatory (otherwise use the man page, it is greatly documented), but just to add some notes:
Transactions: siege was able to hit the target 224 times (HTTP responses below 500)
Elapsed time: The test ran for 9.6 seconds
Successful transactions: From all transactions, 224 transactions were successful
Availability: . ergo resulting in 100% availability
I mentioned before that I was testing a SOAP API balanced through a HAProxy loadbalancer (listening on port 18382 as you probably noticed).
In this particular setup the SOAP servers can only handle a maximum of 6 concurrent connections. In HAProxy I set the maxconn value for each backend server to «6», set a miminum queue and very low queuing time (I don’t want requests to be piled up in a queue, instead HAProxy should deliver an error). The HAProxy backend runs with 16 servers, each allowing 6 concurrent connections. This makes a total of 96 possible concurrent connections (16 x 6). Let’s try siege with 100 concurrent users, there should be some failed requests.
# siege -b —concurrent=100 —content-type=»text/xml;charset=utf-8″ -H «Soapaction: »» ‘http://localhost:18382/ POST < /tmp/xxx' -t 10S
** SIEGE 3.0.8
** Preparing 100 concurrent users for battle.
The server is now under siege.
Lifting the server siege. done.
Transactions: 224 hits
Availability: 39.16 %
Elapsed time: 9.35 secs
Data transferred: 0.13 MB
Response time: 1.52 secs
Transaction rate: 23.96 trans/sec
Throughput: 0.01 MB/sec
Concurrency: 36.34
Successful transactions: 224
Failed transactions: 348
Longest transaction: 5.09
Shortest transaction: 0.00
As in the previous test, siege was able to hit the target 224 times.
However this time there are 348 failed and only 224 successful transactions, resulting in an availability of 39.16%.
And now the same with the max concurrent connections of 96:
# siege -b —concurrent=96 —content-type=»text/xml;charset=utf-8″ -H «Soapaction: »» ‘http://localhost:18382/ POST < /tmp/xxx' -t 10S
** SIEGE 3.0.8
** Preparing 96 concurrent users for battle.
The server is now under siege.
Lifting the server siege. done.
Transactions: 224 hits
Availability: 100.00 %
Elapsed time: 9.38 secs
Data transferred: 0.10 MB
Response time: 1.52 secs
Transaction rate: 23.88 trans/sec
Throughput: 0.01 MB/sec
Concurrency: 36.20
Successful transactions: 224
Failed transactions: 0
Longest transaction: 5.09
Shortest transaction: 0.00
100% success rate here. This is proof that siege used exactly 96 users as HAProxy allowed.
By the way: siege also allows to compare previous test results by checking the log file it creates:
# cat /var/log/siege.log
Date & Time, Trans, Elap Time, Data Trans, Resp Time, Trans Rate, Throughput, Concurrent, OKAY, Failed
2017-08-03 08:56:46, 224, 9.19, 0, 1.52, 24.37, 0.00, 36.95, 224, 340
2017-08-03 09:04:01, 224, 9.35, 0, 1.52, 23.96, 0.00, 36.34, 224, 348
2017-08-03 09:05:24, 224, 9.03, 0, 1.58, 24.81, 0.00, 39.19, 224, 336
2017-08-03 09:05:39, 224, 9.23, 0, 1.50, 24.27, 0.00, 36.50, 224, 329
2017-08-03 09:06:55, 224, 9.49, 0, 1.45, 23.60, 0.00, 34.23, 224, 0
2017-08-03 09:08:03, 224, 9.38, 0, 1.52, 23.88, 0.00, 36.20, 224, 0
Hands down a very good tool for http benchmarking/stress-testing. Not just for POST requests.
Add a comment
Comments (newest first)
Juanga Covas from wrote on Jan 20th, 2022:
Стресс-тест сети (DoS веб-сайта) со SlowHTTPTest в Kali Linux: slowloris, slow body и slow read атаки в одном инструменте
Стресс-тесты сети могут дать важные данные о проблемах, связанных с производительностью сервера, о неправильной (недостаточной) его настройке. Даже чтобы проверить, правильно ли настроен и работает mod_evasive пригодятся утилиты для имитации DoS атак.
Связанные статьи по защите веб-сервера:
- Стресс-тест сети с Low Orbit Ion Cannon (LOIC)
- Стресс-тест сети (DoS веб-сайта) с SlowHTTPTest в Kali Linux: slowloris, slow body и slow read атаки в одном инструменте (вы её читаете)
SlowHTTPTest — это имеющий множество настроек инструмент, симулирующие некоторые атаки отказа в обслуживании (DoS) уровня приложения. Он работает на большинстве платформ Linux, OSX и Cygwin (Unix-подобное окружение и интерфейс командной строки для Microsoft Windows).
Эта программа реализует наиболее общие замедляющие работу сети DoS атаки уровня приложений, такие как Slowloris, атака slow body, атака Slow Read (на основе эксплойта постоянного таймера TCP), она занимает весь доступный пул подключений, а также атака Apache Range Header, которая становится причиной очень значительного использования памяти и центрального процессора на сервере.
Slowloris и Slow HTTP POST DoS атаки полагаются на факт, что HTTP, намеренно, требует от запросов быть полученными сервером полностью до того, как они будут обработаны. Если запрос HTTP неполон или скорость его пересылки очень медленная, сервер сохраняет своио ресурсы занятыми, ожидая оставшихся данных. Если сервер поддерживает слишком много занятых ресурсов, то это влечёт отказ в обслуживании. Этот инструмент отправляет частичные запросы HTTP, пытаясь добиться отказа в обслуживании от целевого HTTP сервера.
Атака Slow Read нацелена на те же ресурсы, что и slowloris со slow body, но вместно продлевания запроса, она отправляет легитимные HTTP запросы, но ответы читает медленно.
Установка SlowHTTPTest
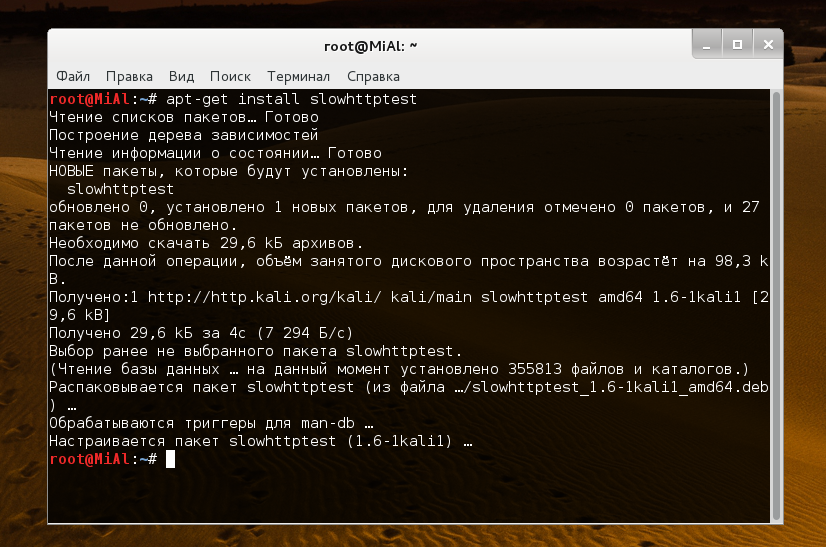
Установка для пользователей Kali Linux
Для пользователей Kali Linux установка через apt-get .. (жизнь хороша!)
apt-get install slowhttptest
Для других дистрибутивов Linux
Инструмент распространяется как портативный пакет, т. е. просто загрузите последний тарбол из секции загрузки, извлеките, настройте, скомпилируйте и установите.
Этот набор команд делает следующее: скачивает самую последнюю версию SlowHTTPTest, распаковывает её и переходим в каталог с программой:
(t=`curl -s https://github.com/shekyan/slowhttptest | grep -E -o '//slowhttptest.googlecode.com/files/slowhttptest(.)*.tar.gz" onclick="' | sed 's/////' | sed 's/" onclick="//' | head -1`; curl -s $t -o slowhttptest-last.tar.gz) && tar -xzvf slowhttptest-last.tar.gz && cd slowhttptest-*
Т.е. теперь только остаётся выполнить конфигурацию, компиляцию и установку.
Для тех, кто предпочитает скачать архив вручную, переходите сюда.
$ tar -xzvf slowhttptest-x.x.tar.gz $ cd slowhttptest-x.x $ ./configure --prefix=PREFIX $ make $ sudo make install
Здесь PREFIX должен быть заменён на абсолютный путь, где инструмент slowhttptest должен быть установлен.
У вас должна быть установлена libssl-dev для успешной компиляции этого инструмента. Большинство систем должны иметь его.
Mac OS X
brew update && brew install slowhttptest
Linux
Попробуйте ваш любимый пакетный менеджер, некоторые из них знают о slowhttptest (как Kali Linux).
Использование SlowHTTPTest
slowhttptest это потрясающий инструмент, который позволяет делать многие вещи. Далее только несколько примеров использования.
Пример использования в режиме slow body a.k.a R-U-Dead-Yet, результаты только выводятся на экран
slowhttptest -c 1000 -B -i 110 -r 200 -s 8192 -t FAKEVERB -u http://192.168.1.37/info.php -x 10 -p 3
Тоже самое, но график сохраняется в файл
slowhttptest -c 1000 -B -g -o my_body_stats -i 110 -r 200 -s 8192 -t FAKEVERB -u http://192.168.1.37/info.php -x 10 -p 3