- CoreFreq – A Powerful CPU Monitoring Tool for Linux Systems
- How Does CoreFreq Works
- How to Install CoreFreq in Linux
- Ubuntu CPU Monitor
- Monitor CPU Performance with top Command
- Monitor CPU Usage with htop Command
- Monitor CPU Usage with sysstat Package
- The vmstat Command
- Monitor CPU with gnome GUI
- Conclusion
- About the author
- Karim Buzdar
CoreFreq – A Powerful CPU Monitoring Tool for Linux Systems
CoreFreq is a CPU monitoring program intended for the Intel 64-bits processor and supports architectures such as Atom, Core2, Nehalem, SandyBridge and above, AMD Family 0F.
Its core is established on a kernel module which helps to retrieve internal performance counters from each CPU core, and works in relation with a daemon which gathers the data and a small console client links to the daemon and displays collected data.
It offers a groundwork to recapture CPU data with a high degree of accuracy:
- Core frequencies & ratios; SpeedStep (EIST), Turbo Boost, Hyper-Threading (HTT) as well as Base Clock.
- Performance counters in conjunction with Time Stamp Counter (TSC), Unhalted Core Cycles (UCC), Unhalted Reference Cycles (URC).
- Number of instructions per cycle or second, IPS, IPC, or CPI.
- CPU C-States C0 C1 C3 C6 C7 – C1E – Auto/UnDemotion of C1 C3.
- DTS Temperature along with Tjunction Max, Thermal Monitoring TM1 TM2 state.
- Topology map including Caches for boostrap together with application CPU.
- Processor features, brand plus architecture strings.
Note: This tool is more useful and appropriate for expert Linux users and experienced system administrators, however, novice users can gradually learn how to purposefully use it.
How Does CoreFreq Works
It functions by invoking a Linux Kernel module which then uses:
- asm code to keep the readings of the performance counters as close as possible.
- per-CPU, effects slab data memory plus high-resolution timer.
- compliant with suspend / resume and CPU Hot-Plug.
- a shared memory to protect kernel from the user-space part of the program.
- atomic synchronization of threads to do away with mutexes and deadlock.
How to Install CoreFreq in Linux
To install CoreFreq, first you need to install the prerequisites (Development Tools) to compile and build the program from source.
$ sudo yum group install 'Development Tools' [On CentOS/RHEL] $ sudo dnf group install 'Development Tools' [On Fedora 22+ Versions] # sudo apt-get install dkms git libpthread-stubs0-dev [On Debian/Ubuntu]
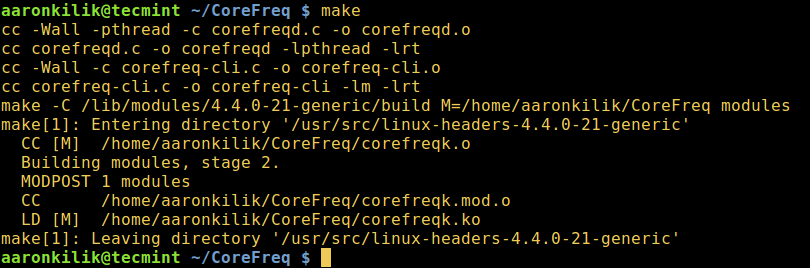
Next clone the CoreFreq source code from the Github repository, move into the download folder and compile and build the program:
$ git clone https://github.com/cyring/CoreFreq.git $ cd CoreFreq $ make
Note: Arch Linux users can install corefreq-git from the AUR.
Now run the following commands to load the Linux kernel module from local directory followed by the daemon:
$ sudo insmod corefreqk.ko $ sudo ./corefreqd
Then, start the client, as a user.
From the interface above, you can use shortcut keys:
- F2 to display a usage menu as seen at the top section of the screen.
- Right and Left arrows to move over the menu tabs.
- Up and Down arrows to select a menu item, then click [Enter].
- F4 will close the program.
- h will open a quick reference.
To view all usage options, type the command below:
CoreFreq. Copyright (C) 2015-2017 CYRIL INGENIERIE usage: corefreq-cli [-option ] -t Show Top (default) -d Show Dashboard arguments: -c Monitor Counters -i Monitor Instructions -s Print System Information -M Print Memory Controller -m Print Topology -u Print CPUID -k Print Kernel -h Print out this message Exit status: 0 if OK, 1 if problems, >1 if serious trouble. Report bugs to labs[at]cyring.fr
To print info about the kernel, run:
Print CPU identification details:
You can as well monitor CPU instructions in real-time:
Enable tracing of counters as below:
For more information and usage, visit the CoreFreq Github repository: https://github.com/cyring/CoreFreq
In this article, we reviewed a powerful CPU monitoring tool, which may be more useful to Linux experts or experienced system administrators as compared to novice users.
Share your thoughts about this command tool or any related ideas with us via the feedback form below.
Ubuntu CPU Monitor
![]()
It is important to keep track of server performance while working on the Ubuntu Linux environment as a system administrator. One method to measure the server performance is to check the usage of CPU in your system. This will give you a complete system performance insight related to the hardware resources that are used by different running services. All administration related tasks can be easily performed through the Linux command line, as compared to the graphical user interface.
This article will explore a few tricks that are useful to check CPU usage for Linux systems on Ubuntu 20.04. If you are the administrator of the server or working on a personal desktop, it is easy to monitor the system’s CPU usage on Ubuntu 20.04 using the command line.
This article will discuss commands that are useful to monitor your system’s CPU usage in Ubuntu 20.04. First, open the terminal application using the shortcut Ctrl + Alt + T.
Monitor CPU Performance with top Command
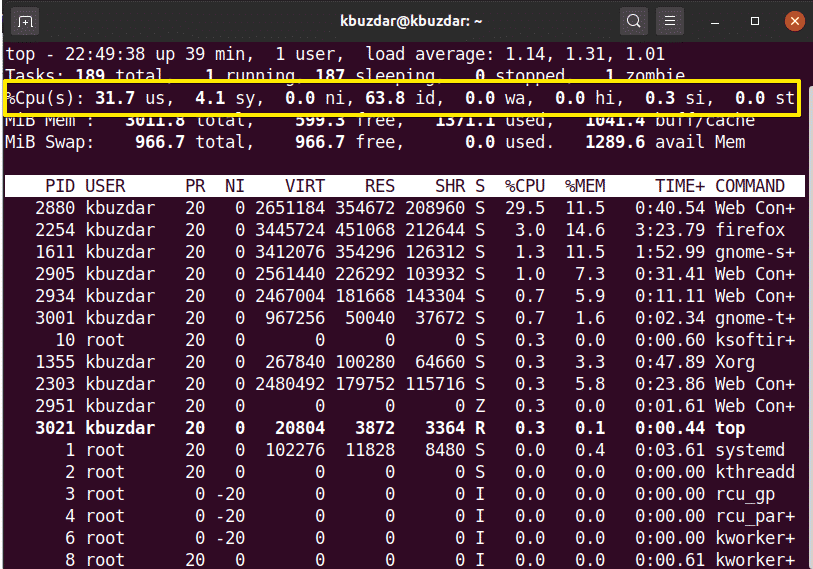
The top command is used to check your system’s CPU usage. To understand the output from the top command is complex, but this command provides the complete CPU usage information on your system. In Ubuntu 20.04 and more other Linux environments, this utility is installed by default. Input the following command on the terminal to monitor the system’s CPU usage:
The following output will generate on your terminal, giving live insights into the services running on the system, the total number of resources being used, and a summary of CPU usage in your system.
Monitor CPU Usage with htop Command
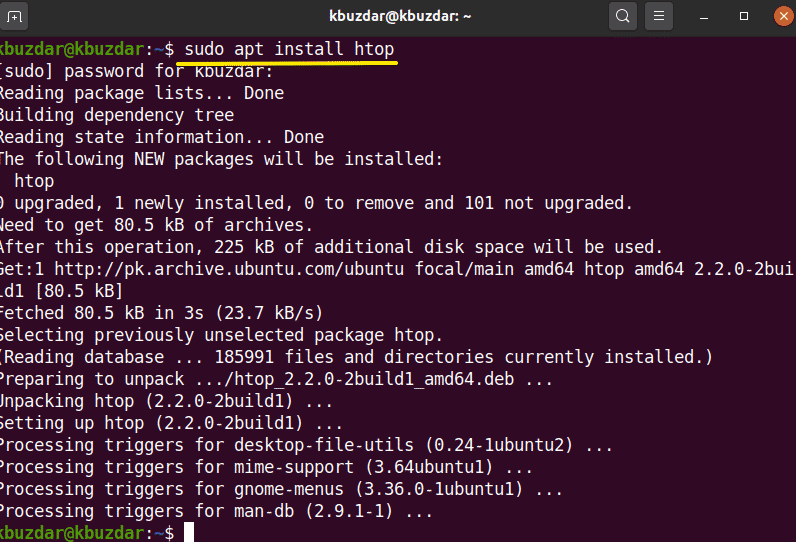
The htop command is similar to the top command. The htop command gives detailed information about your CPU and other resource usage. This command is not installed on the Ubuntu system, so you will need to install the htop command on your system. To install the htop command, first update the apt repository of your Ubuntu 20.04 system using the following command:
Next, install the htop on your system using the apt repository:
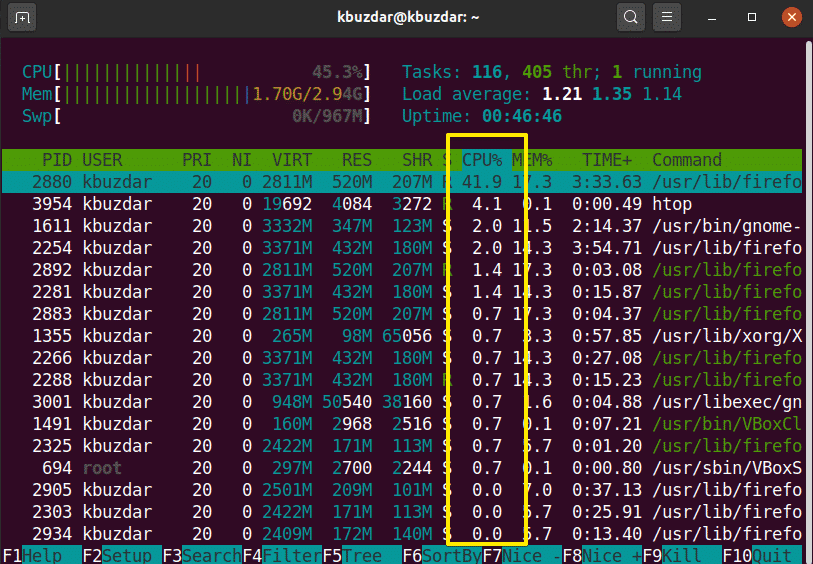
Once you have installed the htop utility on Ubuntu 20.04, you may view a detailed summary of the CPU usage on your system using the following command in the terminal application:
Monitor CPU Usage with sysstat Package
There are additional methods available to monitor CPU usage on your system. To use these methods, install the ‘sysstat’ package on your Linux system. To install this package, run the following command in the terminal:

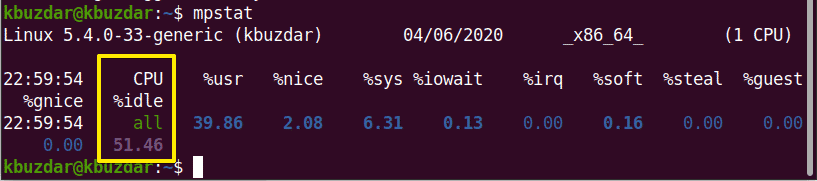
Once the sysstat utility is installed on your system, you may access the ‘mpstat’ command to view the CPU usage on your system. The ‘mpstat’ command gives the same output as a ‘top’ command, but in a more precise format, as follows:
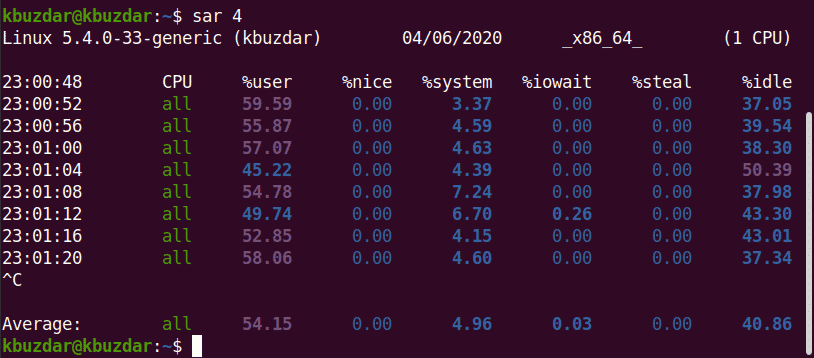
In a sysstat package, one more command is included. This command is known as the ‘sar’ command, in which you can define a number that gives the information in seconds of CPU usage.
For example, if you want to monitor CPU usage after every 4 seconds, enter the following command:
Using the sar command, you can also stop the command after a specified number of iterations.

For example, in the following image, the sar command will monitor CPU usage every 3 seconds for 4 iterations.
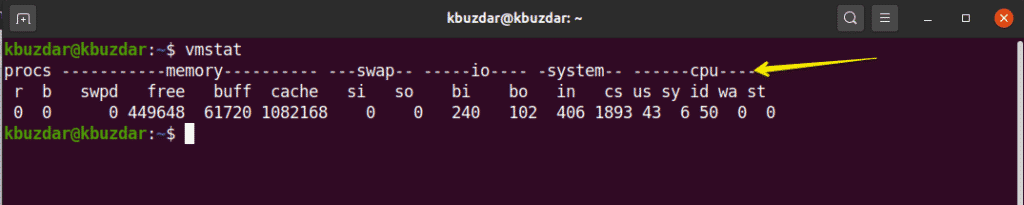
The vmstat Command
You can also check CPU usage sing the vmstat command. Run this command on the terminal, as follows:
Monitor CPU with gnome GUI
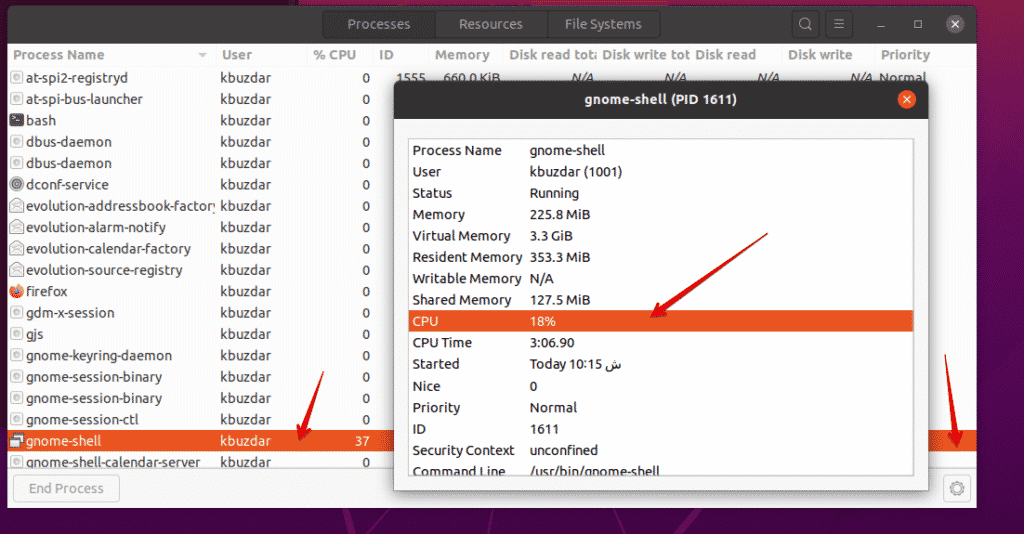
If you would like to monitor your system’s CPU usage using the GUI desktop environment, you may use the default gnome tool. To open the gnome tool, you need to execute the following command on the terminal. You may also open this tool from your system’s applications.
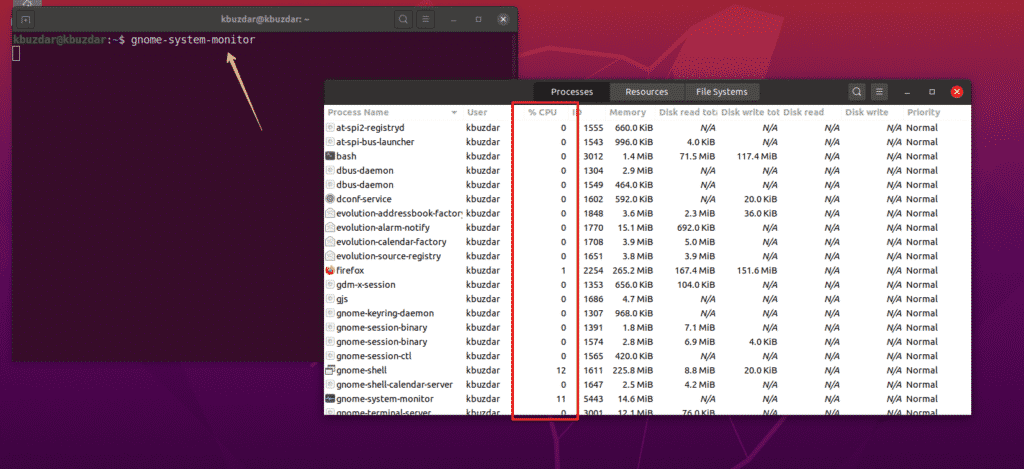
The gnome window will appear on the system. In this window, you can check running processes and their CPU usage. Select a process and click on the setting icon. Here, you can see the details about the selected task:
Conclusion
In this article, you have seen how to monitor CPU usage on your Ubuntu Linux system. You learned about various tools that you can use to monitor your system’s CPU usage. Using these methods, you can perform a detailed analysis of CPU usage on your system and you can handle system resources according to your needs.
About the author
Karim Buzdar
Karim Buzdar holds a degree in telecommunication engineering and holds several sysadmin certifications. As an IT engineer and technical author, he writes for various web sites. He blogs at LinuxWays.