Linux: find out what process is using all the RAM?
Before actually asking, just to be clear: yes, I know about disk cache, and no, it is not my case 🙂 Sorry, for this preamble 🙂 I’m using CentOS 5. Every application in the system is swapping heavily, and the system is very slow. When I do free -m , here is what I got:
total used free shared buffers cached Mem: 3952 3929 22 0 1 18 -/+ buffers/cache: 3909 42 Swap: 16383 46 16337 So, I actually have only 42 Mb to use! As far as I understand, -/+ buffers/cache actually doesn’t count the disk cache, so I indeed only have 42 Mb, right? I thought, I might be wrong, so I tried to switch off the disk caching and it had no effect — the picture remained the same. So, I decided to find out who is using all my RAM, and I used top for that. But, apparently, it reports that no process is using my RAM. The only process in my top is MySQL, but it is using 0.1% of RAM and 400Mb of swap. Same picture when I try to run other services or applications — all go in swap, top shows that MEM is not used (0.1% maximum for any process).
top - 15:09:00 up 2:09, 2 users, load average: 0.02, 0.16, 0.11 Tasks: 112 total, 1 running, 111 sleeping, 0 stopped, 0 zombie Cpu(s): 0.0%us, 0.0%sy, 0.0%ni,100.0%id, 0.0%wa, 0.0%hi, 0.0%si, 0.0%st Mem: 4046868k total, 4001368k used, 45500k free, 748k buffers Swap: 16777208k total, 68840k used, 16708368k free, 16632k cached PID USER PR NI VIRT RES SHR S %CPU %MEM TIME+ SWAP COMMAND 3214 ntp 15 0 23412 5044 3916 S 0.0 0.1 0:00.00 17m ntpd 2319 root 5 -10 12648 4460 3184 S 0.0 0.1 0:00.00 8188 iscsid 2168 root RT 0 22120 3692 2848 S 0.0 0.1 0:00.00 17m multipathd 5113 mysql 18 0 474m 2356 856 S 0.0 0.1 0:00.11 472m mysqld 4106 root 34 19 251m 1944 1360 S 0.0 0.0 0:00.11 249m yum-updatesd 4109 root 15 0 90152 1904 1772 S 0.0 0.0 0:00.18 86m sshd 5175 root 15 0 90156 1896 1772 S 0.0 0.0 0:00.02 86m sshd Restart doesn’t help, and, by they way is very slow, which I wouldn’t normally expect on this machine (4 cores, 4Gb RAM, RAID1). So, with that — I’m pretty sure that this is not a disk cache, who is using the RAM, because normally it should have been reduced and let other processes to use RAM, rather then go to swap. So, finally, the question is — if someone has any ideas how to find out what process is actually using the memory so heavily?
How to Check Memory Usage Per Process on Linux
These days, a computer can run many programs at once. The CPU has no problem handling all these programs because CPUs has multiple cores to handle multi-tasking.
Each of these programs runs as one or more processes. Every process allocates some amount of RAM or memory for itself. It is essential for the process to function correctly. If a process fails to allocate enough RAM or memory, then the process can’t be created and the program won’t be able to start.
So, one of the basic task you do on your computer is to check how much memory or RAM (Random Access Memory) each of the process is using. Because, RAM or memory of your computer is limited.
Imagine a case, where you want to run some program and it fails because you don’t have enough memory. May be some of the processes are using a lot of memory that you don’t need right now. You can kill or stop these processes to free up RAM or memory, so that you can start your important programs.
In this article, I will show you how to check memory usage of each of the processes running on your Linux machine. I will be using Debian 9 Stretch for all the demonstration in this article. But it should work on any modern Linux distributions. Let’s get started.
Checking Memory Usage Using ps Command:
You can use the ps command to check memory usage of all the processes on Linux. There is one problem with this procedure. ps don’t really show you how much memory a process uses in KB or MB format, but it will show you how much memory is being used in percentage.
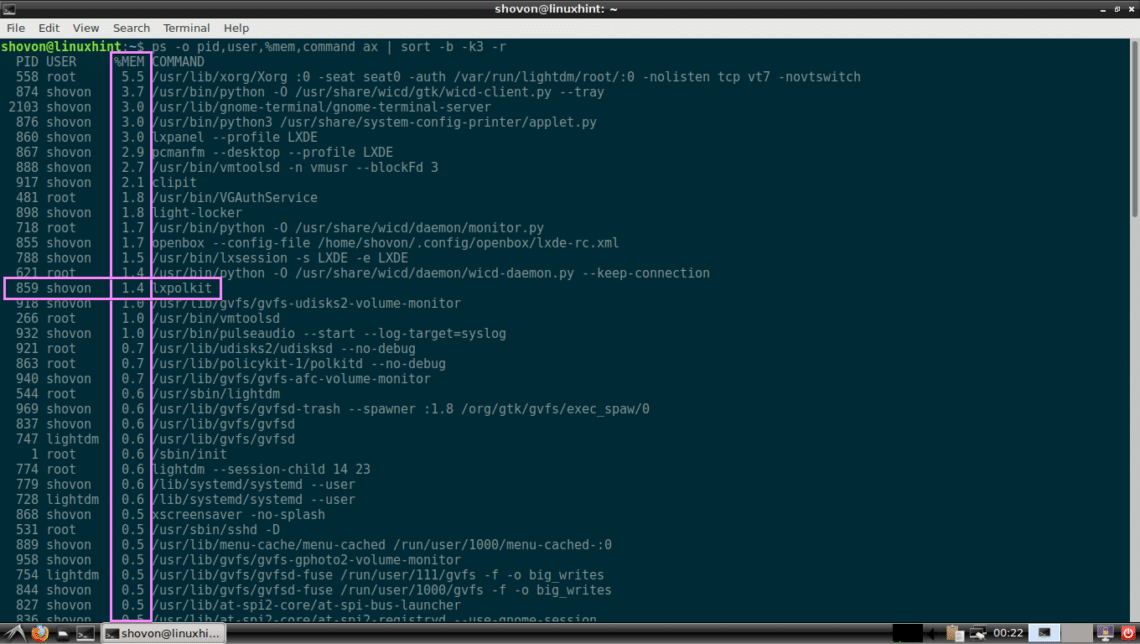
You can check memory usage (in percentage) of all the process running on your Linux operating system with the following command:
As you can see, all the processes with memory usage in percentage is listed in descending order (The processes using most of the memory is listed first).
Checking Memory Usage of Processes with pmap:
You can check memory of a process or a set of processes in human readable format (in KB or kilobytes) with pmap command. All you need is the PID of the processes you want to check memory usage of.
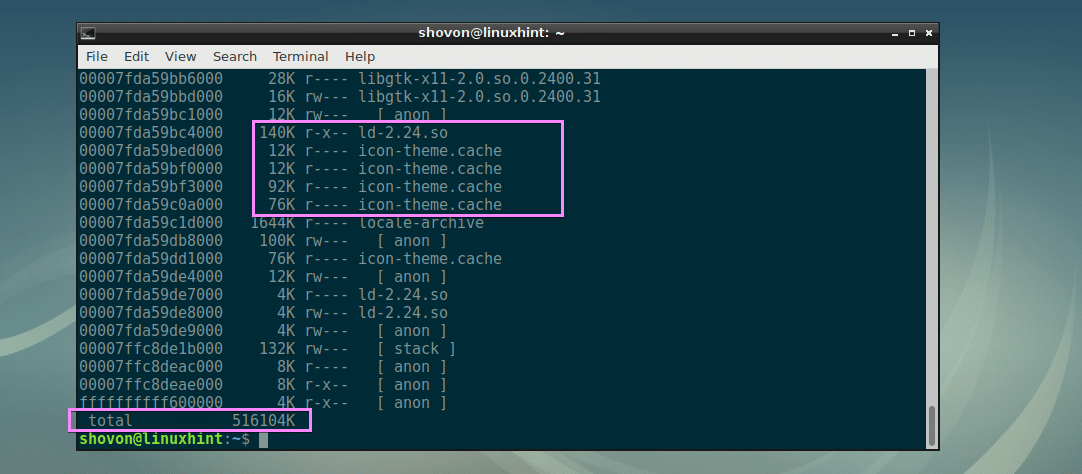
Let’s say, you want to check how much memory the process with PID 917 is using. To do that, run pmap as follows:
As you can see, the total memory used by the process 917 is 516104 KB or kilobytes. You can also see how much memory the libraries and other files required to run the process with PID 917 is using as well here.
If you don’t care about how much memory the libraries or other dependent files are using, then run pmap as follows:
As you can see, only the total memory used by the process with PID 917 is printed on the screen.
If you want, you can further filter this with awk and get only the size in KB or kilobytes. To do that, run pmap as follows:
$ sudo pmap 917 | tail -n 1 | awk ‘/4K/
As you can see, only the memory usage in KB or kilobytes is printed.
Now you can also list how much memory is used by multiple processes using their PIDs with pmap as follows:
NOTE: Here 917 and 531 are process IDs or PIDs. You can put as many PIDs as you want this way.
Using pmap to List Memory Usage of All the Processes in Kilobytes:
In this section, I will show you how to write your own shell script to list memory usage of all the processes running on your Linux operating system in human readable format (kilobytes or KB).
First make a new file sysmon in your current working directory with the following command:
Now make the file executable with the following command:
sysmon is the shell script that will display all the running processes PID, OWNER, MEMORY (in KB in descending order) and COMMAND. Let’s start.
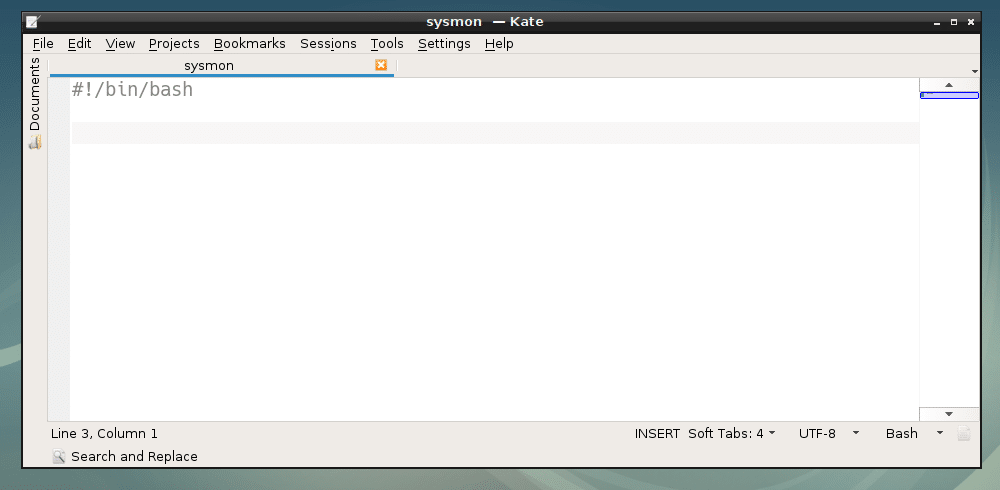
Open the sysmon script with your favorite text editor, I am going to use Kate.
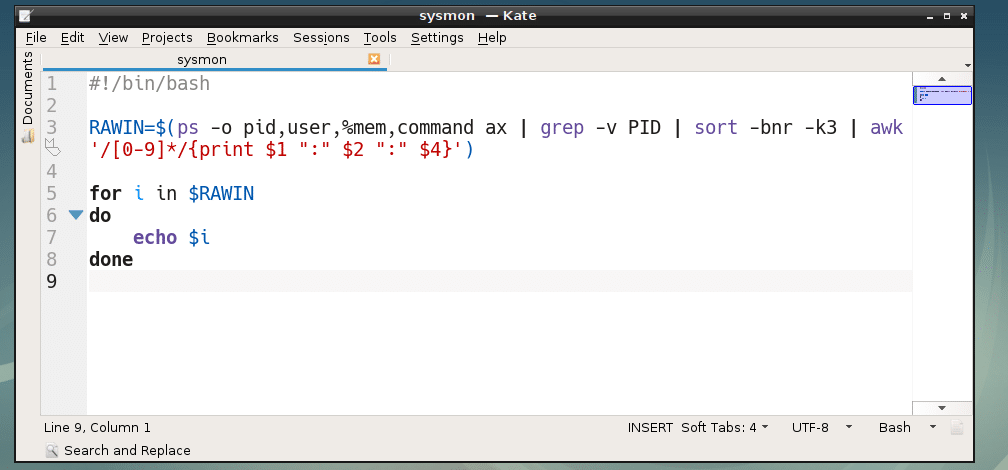
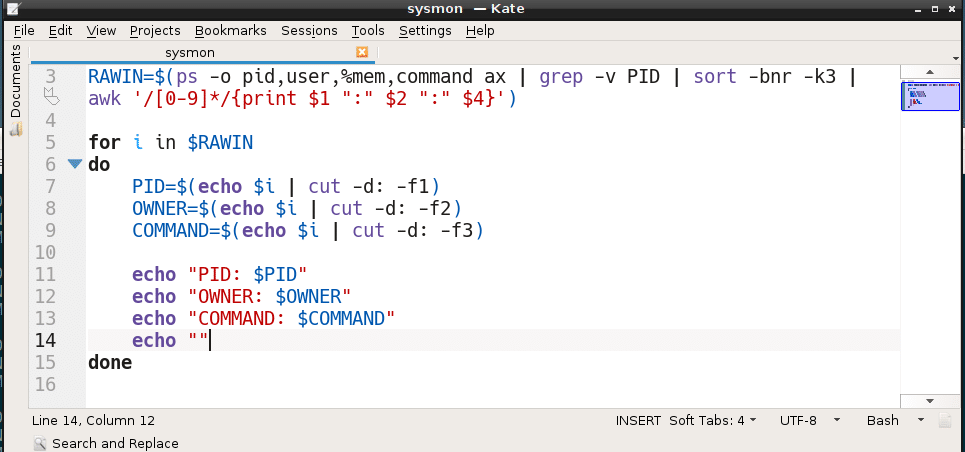
Now, the first command I am going to run will give me the PID, OWNER and COMMAND of all the running processes separated by colon (:) symbol and store it in the RAWIN variable. Then loop through the output and print it on the screen.
As you can see, I am getting the correct output.
Now it’s time to process each line, store the colon delimited information in separate variables. That’s what I did on line 7, 8 and 9.
As you can see, I can print PID, OWNER and COMMAND in my own format now.
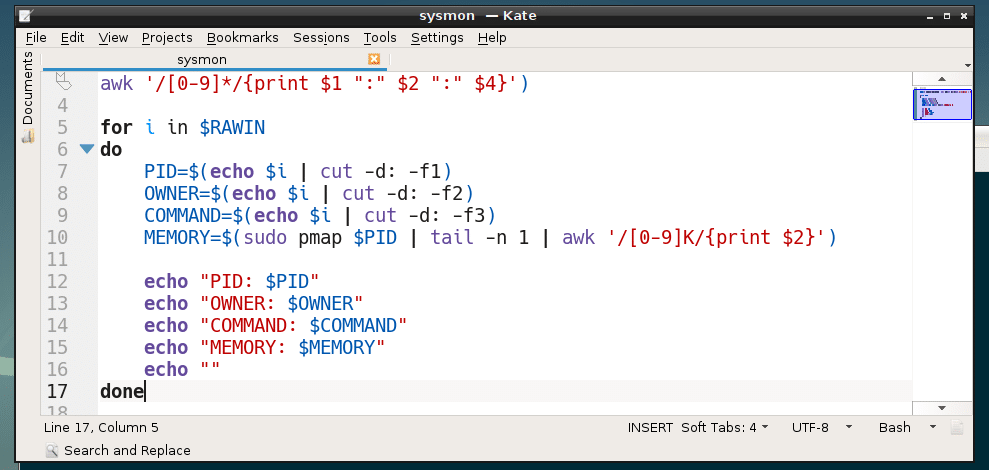
Now it’s time to fetch memory usage of each PID. Line 10 does just that.
As you can see, everything is working perfectly. Now I can print memory usage of each process in kilobytes (KB) as well.
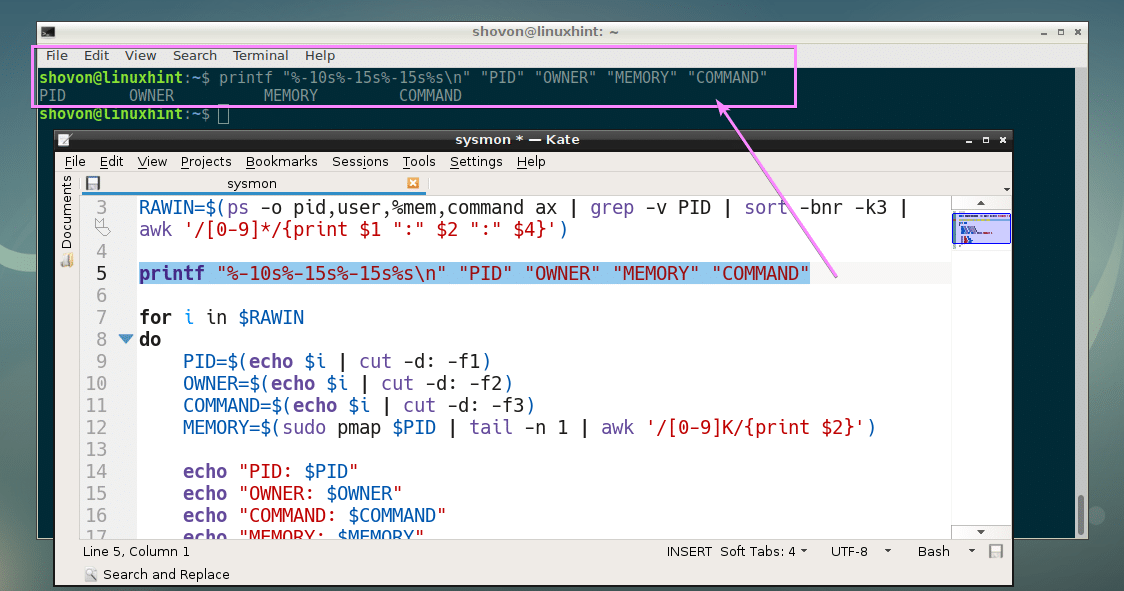
Now all that is left to do is format the output to look nice. I prefer table format. Line 5 prints the header of each column of the table.
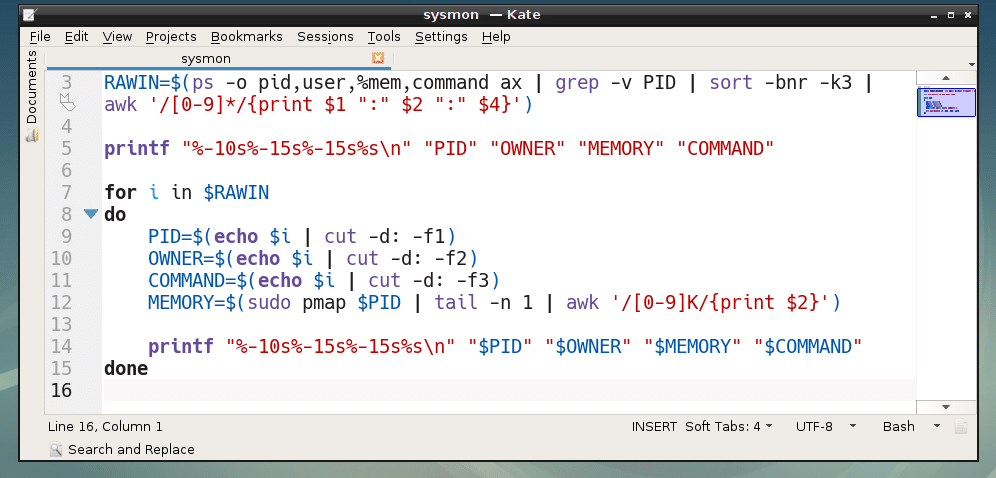
Finally, I printed PID, OWNER, MEMORY (in KB) and COMMAND of each processes in a tabular format using line 14.
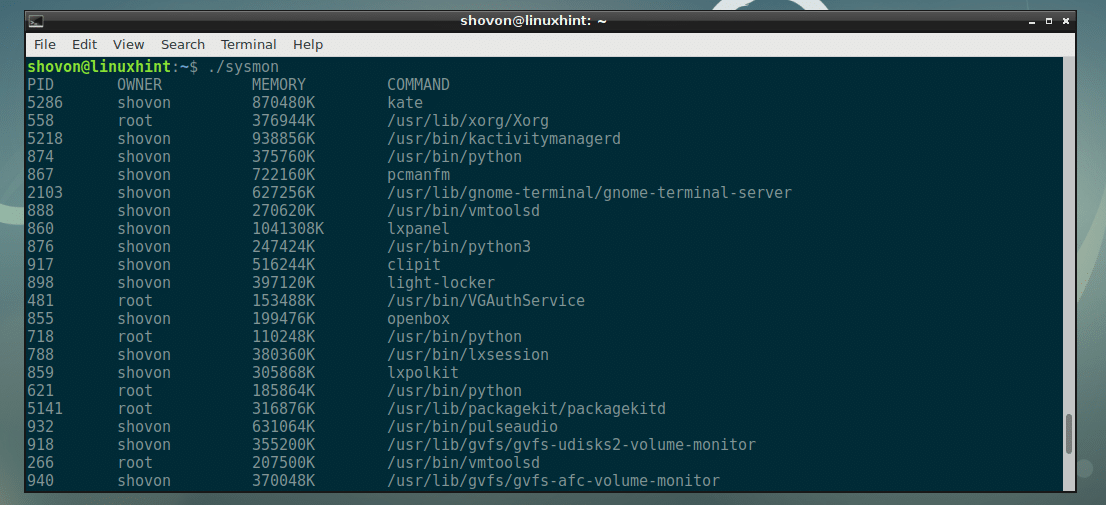
As you can see, it’s working kinda well. There is a little bit of problem though, the processes are not correctly sorted in descending order by memory usage.
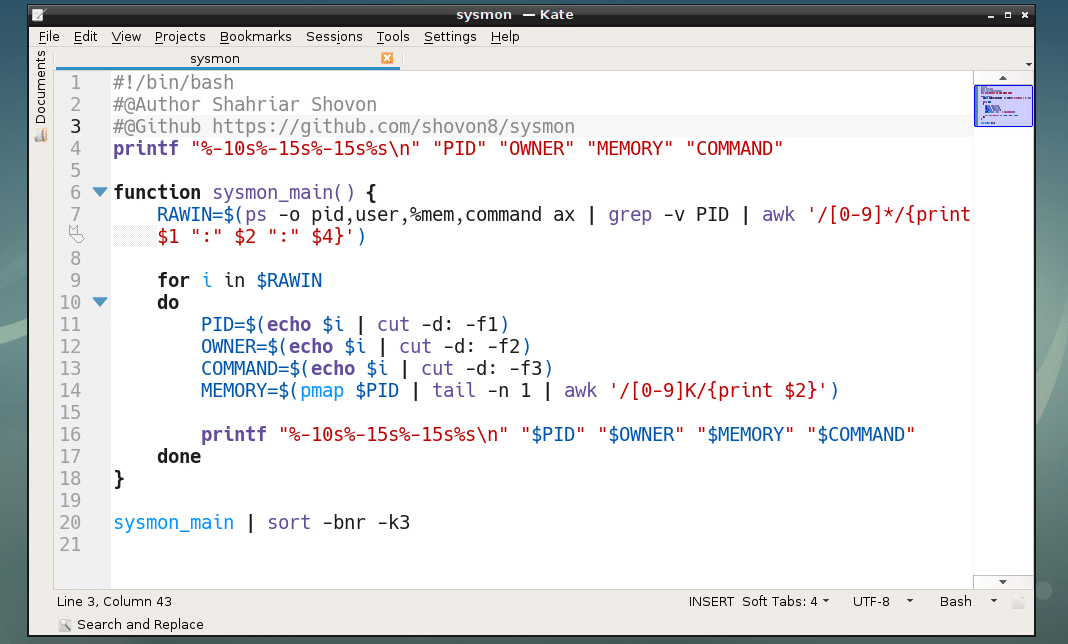
To fix that, I removed sort -bnr -k3 from line 3 and wrapped everything in a shell function sysmon_main(). Then left the job of sorting to the sort command.
The final shell script looks something like this:
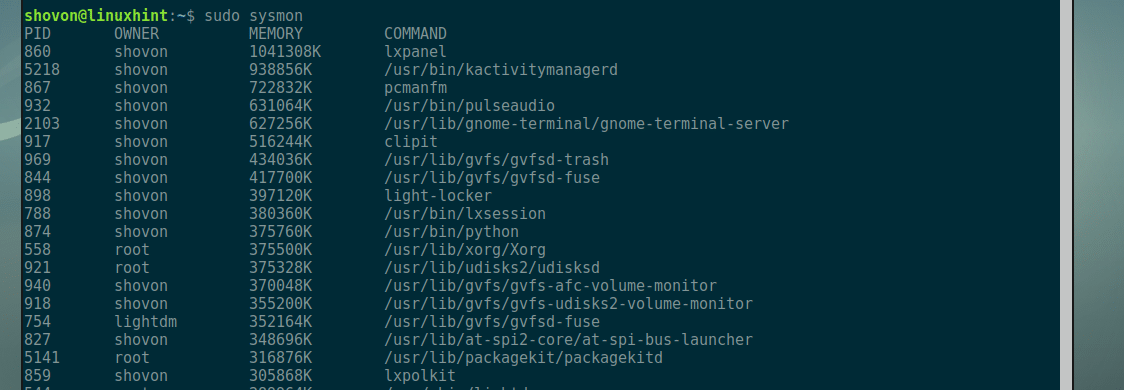
As you can see, it works great.
Now you can move it to somewhere like /usr/bin and execute it just like other commands as follows:
Executing sysmon:
Thanks for reading this article.


