- Chapter 20. Analyzing a core dump
- 20.1. Installing the crash utility
- 20.2. Running and exiting the crash utility
- 20.3. Displaying various indicators in the crash utility
- 20.4. Using Kernel Oops Analyzer
- 20.5. The Kdump Helper tool
- Enable and Analyse Core Dumps in Linux
- Core Dumps on CPU Signals
- Preconditions
- Enabling Core Dumps
- Trigger a Core Dump
- Create a Core Dump of a Running Application
- Analysing Core Dumps
Chapter 20. Analyzing a core dump
To determine the cause of the system crash, you can use the crash utility, which provides an interactive prompt very similar to the GNU Debugger (GDB). This utility allows you to interactively analyze a core dump created by kdump , netdump , diskdump or xendump as well as a running Linux system. Alternatively, you have the option to use Kernel Oops Analyzer or the Kdump Helper tool.
20.1. Installing the crash utility
Install the crash tool to obtain the core analysis suite.
- Enable the relevant repositories:
# subscription-manager repos --enable baseos repository# subscription-manager repos --enable appstream repository# subscription-manager repos --enable rhel-8-for-x86_64-baseos-debug-rpms # yum install crash# yum install kernel-debuginfoAdditional resources
20.2. Running and exiting the crash utility
Start the crash utility for analyzing the cause of the system crash.
Prerequisites
- To start the crash utility, two necessary parameters need to be passed to the command:
- The debug-info (a decompressed vmlinuz image), for example /usr/lib/debug/lib/modules/4.18.0-5.el8.x86_64/vmlinux provided through a specific kernel-debuginfo package.
- The actual vmcore file, for example /var/crash/127.0.0.1-2018-10-06-14:05:33/vmcore The resulting crash command then looks like this:
# crash /usr/lib/debug/lib/modules/4.18.0-5.el8.x86_64/vmlinux /var/crash/127.0.0.1-2018-10-06-14:05:33/vmcoreThe following example shows analyzing a core dump created on October 6 2018 at 14:05 PM, using the 4.18.0-5.el8.x86_64 kernel.
. WARNING: kernel relocated [202MB]: patching 90160 gdb minimal_symbol values KERNEL: /usr/lib/debug/lib/modules/4.18.0-5.el8.x86_64/vmlinux DUMPFILE: /var/crash/127.0.0.1-2018-10-06-14:05:33/vmcore [PARTIAL DUMP] CPUS: 2 DATE: Sat Oct 6 14:05:16 2018 UPTIME: 01:03:57 LOAD AVERAGE: 0.00, 0.00, 0.00 TASKS: 586 NODENAME: localhost.localdomain RELEASE: 4.18.0-5.el8.x86_64 VERSION: #1 SMP Wed Aug 29 11:51:55 UTC 2018 MACHINE: x86_64 (2904 Mhz) MEMORY: 2.9 GB PANIC: "sysrq: SysRq : Trigger a crash" PID: 10635 COMMAND: "bash" TASK: ffff8d6c84271800 [THREAD_INFO: ffff8d6c84271800] CPU: 1 STATE: TASK_RUNNING (SYSRQ) crash>
crash> exit ~]# The crash command can also be used as a powerful tool for debugging a live system. However use it with caution so as not to break your system.
Additional resources
20.3. Displaying various indicators in the crash utility
Use the crash utility to display various indicators, such as a kernel message buffer, a backtrace, a process status, virtual memory information and open files.
- To display the kernel message buffer, type the log command at the interactive prompt as displayed in the example below:
crash> log . several lines omitted . EIP: 0060:[] EFLAGS: 00010096 CPU: 2 EIP is at sysrq_handle_crash+0xf/0x20 EAX: 00000063 EBX: 00000063 ECX: c09e1c8c EDX: 00000000 ESI: c0a09ca0 EDI: 00000286 EBP: 00000000 ESP: ef4dbf24 DS: 007b ES: 007b FS: 00d8 GS: 00e0 SS: 0068 Process bash (pid: 5591, ti=ef4da000 task=f196d560 task.ti=ef4da000) Stack: c068146b c0960891 c0968653 00000003 00000000 00000002 efade5c0 c06814d0 fffffffb c068150f b7776000 f2600c40 c0569ec4 ef4dbf9c 00000002 b7776000 efade5c0 00000002 b7776000 c0569e60 c051de50 ef4dbf9c f196d560 ef4dbfb4 Call Trace: [] ? __handle_sysrq+0xfb/0x160 [] ? write_sysrq_trigger+0x0/0x50 [] ? write_sysrq_trigger+0x3f/0x50 [] ? proc_reg_write+0x64/0xa0 [] ? proc_reg_write+0x0/0xa0 [] ? vfs_write+0xa0/0x190 [] ? sys_write+0x41/0x70 [] ? syscall_call+0x7/0xb Code: a0 c0 01 0f b6 41 03 19 d2 f7 d2 83 e2 03 83 e0 cf c1 e2 04 09 d0 88 41 03 f3 c3 90 c7 05 c8 1b 9e c0 01 00 00 00 0f ae f8 89 f6 05 00 00 00 00 01 c3 89 f6 8d bc 27 00 00 00 00 8d 50 d0 83 EIP: [] sysrq_handle_crash+0xf/0x20 SS:ESP 0068:ef4dbf24 CR2: 0000000000000000
Type help log for more information about the command usage.
The kernel message buffer includes the most essential information about the system crash and, as such, it is always dumped first in to the vmcore-dmesg.txt file. This is useful when an attempt to get the full vmcore file failed, for example because of lack of space on the target location. By default, vmcore-dmesg.txt is located in the /var/crash/ directory.
crash> bt PID: 5591 TASK: f196d560 CPU: 2 COMMAND: "bash" #0 [ef4dbdcc] crash_kexec at c0494922 #1 [ef4dbe20] oops_end at c080e402 #2 [ef4dbe34] no_context at c043089d #3 [ef4dbe58] bad_area at c0430b26 #4 [ef4dbe6c] do_page_fault at c080fb9b #5 [ef4dbee4] error_code (via page_fault) at c080d809 EAX: 00000063 EBX: 00000063 ECX: c09e1c8c EDX: 00000000 EBP: 00000000 DS: 007b ESI: c0a09ca0 ES: 007b EDI: 00000286 GS: 00e0 CS: 0060 EIP: c068124f ERR: ffffffff EFLAGS: 00010096 #6 [ef4dbf18] sysrq_handle_crash at c068124f #7 [ef4dbf24] __handle_sysrq at c0681469 #8 [ef4dbf48] write_sysrq_trigger at c068150a #9 [ef4dbf54] proc_reg_write at c0569ec2 #10 [ef4dbf74] vfs_write at c051de4e #11 [ef4dbf94] sys_write at c051e8cc #12 [ef4dbfb0] system_call at c0409ad5 EAX: ffffffda EBX: 00000001 ECX: b7776000 EDX: 00000002 DS: 007b ESI: 00000002 ES: 007b EDI: b7776000 SS: 007b ESP: bfcb2088 EBP: bfcb20b4 GS: 0033 CS: 0073 EIP: 00edc416 ERR: 00000004 EFLAGS: 00000246 Type bt to display the backtrace of a specific process or type help bt for more information about bt usage.
Displaying a process status
crash> ps PID PPID CPU TASK ST %MEM VSZ RSS COMM > 0 0 0 c09dc560 RU 0.0 0 0 [swapper] > 0 0 1 f7072030 RU 0.0 0 0 [swapper] 0 0 2 f70a3a90 RU 0.0 0 0 [swapper] > 0 0 3 f70ac560 RU 0.0 0 0 [swapper] 1 0 1 f705ba90 IN 0.0 2828 1424 init . several lines omitted . 5566 1 1 f2592560 IN 0.0 12876 784 auditd 5567 1 2 ef427560 IN 0.0 12876 784 auditd 5587 5132 0 f196d030 IN 0.0 11064 3184 sshd > 5591 5587 2 f196d560 RU 0.0 5084 1648 bash Use ps to display the status of a single specific process. Use help ps for more information about ps usage.
Displaying virtual memory information
crash> vm PID: 5591 TASK: f196d560 CPU: 2 COMMAND: "bash" MM PGD RSS TOTAL_VM f19b5900 ef9c6000 1648k 5084k VMA START END FLAGS FILE f1bb0310 242000 260000 8000875 /lib/ld-2.12.so f26af0b8 260000 261000 8100871 /lib/ld-2.12.so efbc275c 261000 262000 8100873 /lib/ld-2.12.so efbc2a18 268000 3ed000 8000075 /lib/libc-2.12.so efbc23d8 3ed000 3ee000 8000070 /lib/libc-2.12.so efbc2888 3ee000 3f0000 8100071 /lib/libc-2.12.so efbc2cd4 3f0000 3f1000 8100073 /lib/libc-2.12.so efbc243c 3f1000 3f4000 100073 efbc28ec 3f6000 3f9000 8000075 /lib/libdl-2.12.so efbc2568 3f9000 3fa000 8100071 /lib/libdl-2.12.so efbc2f2c 3fa000 3fb000 8100073 /lib/libdl-2.12.so f26af888 7e6000 7fc000 8000075 /lib/libtinfo.so.5.7 f26aff2c 7fc000 7ff000 8100073 /lib/libtinfo.so.5.7 efbc211c d83000 d8f000 8000075 /lib/libnss_files-2.12.so efbc2504 d8f000 d90000 8100071 /lib/libnss_files-2.12.so efbc2950 d90000 d91000 8100073 /lib/libnss_files-2.12.so f26afe00 edc000 edd000 4040075 f1bb0a18 8047000 8118000 8001875 /bin/bash f1bb01e4 8118000 811d000 8101873 /bin/bash f1bb0c70 811d000 8122000 100073 f26afae0 9fd9000 9ffa000 100073 . several lines omitted .
Use vm to display information about a single specific process, or use help vm for more information about vm usage.
crash> files PID: 5591 TASK: f196d560 CPU: 2 COMMAND: "bash" ROOT: / CWD: /root FD FILE DENTRY INODE TYPE PATH 0 f734f640 eedc2c6c eecd6048 CHR /pts/0 1 efade5c0 eee14090 f00431d4 REG /proc/sysrq-trigger 2 f734f640 eedc2c6c eecd6048 CHR /pts/0 10 f734f640 eedc2c6c eecd6048 CHR /pts/0 255 f734f640 eedc2c6c eecd6048 CHR /pts/0 Use files to display files opened by only one selected process, or use help files for more information about files usage.
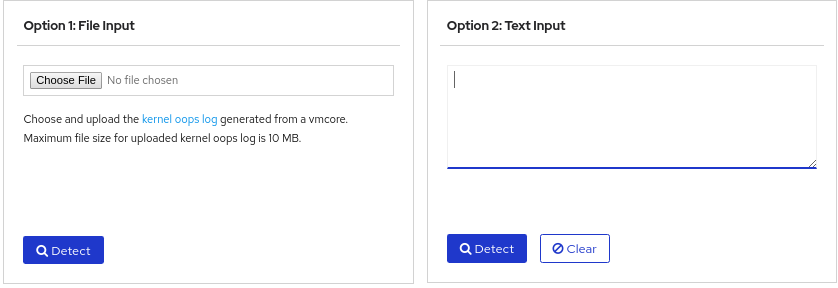
20.4. Using Kernel Oops Analyzer
The Kernel Oops Analyzer tool analyzes the crash dump by comparing the oops messages with known issues in the knowledge base.
Prerequisites
- Access the Kernel Oops Analyzer tool.
- To diagnose a kernel crash issue, upload a kernel oops log generated in vmcore .
- Alternatively you can also diagnose a kernel crash issue by providing a text message or a vmcore-dmesg.txt as an input.
Additional resources
20.5. The Kdump Helper tool
The Kdump Helper tool helps to set up the kdump using the provided information. Kdump Helper generates a configuration script based on your preferences. Initiating and running the script on your server sets up the kdump service.
Additional resources
Enable and Analyse Core Dumps in Linux
To debug an executable one can run it under control of gdbserver/gdb. This also allows to debug issues with abnormal termination caused by receiving signals. See Hello World application on Embedded Linux for a possible setup. For cases which do not allow to run gdb core dumps can help in debugging issues with abnormal termination. The Linux kernel can write a file containing the state of a process when the process receives certain signals, e.g. segmentation fault or illegal instruction. Such files are called core dumps and contain a snapshot of the allocated memory and registers and can later be used with gdb to analyse the causes of the signal. See also ‘man core’.
Core Dumps on CPU Signals
Preconditions
Make sure the Linux kernel has the needed configuration options set as we don’t enable these by default. Check and if needed recompile the kernel with enabled core dump options. Check for 3.0, 3.1 kernels:
zcat /proc/config.gz | grep CONFIG_ELF_CORE zcat /proc/config.gz | grep CONFIG_COREDUMP Enabling Core Dumps
The following enables core dump generation when a user process triggers a signal and sets the core file location to /tmp/ with a sensible name. Note that these settings aren’t stored persistently.
ulimit -c unlimited echo 1 > /proc/sys/kernel/core_uses_pid echo "/tmp/core-%e-%s-%u-%g-%p-%t" > /proc/sys/kernel/core_pattern echo 2 > /proc/sys/fs/suid_dumpable Depending on the memory usage of a process core files can be huge. Enabling core dumps on a system can fill up its mass storage over time. To enable core dumps on production systems it is highly recommended to use a daemon to manage the core dumps (e.g. make sure that the core dumps do not use more than a certain amount of space). Systemd might be a viable solution for this, however the coredump functionality is not enabled by default in OpenEmbedded (see recipes-core/systemd/systemd_xxx.bb in OpenEmbedded core).
Trigger a Core Dump
To test the creation of core dumps, one can use the kill command to send a segmentation fault signal to the process:
Create a Core Dump of a Running Application
To create a single core dump without provoking an abnormal process termination the utility gcore can be used. This allows to create a core dump at any time of execution. The utility gcore is part of gdb, one can install it using the package feeds:
# gcore -o /tmp/core-myapp 280 0x76f46588 in read () from /lib/libc.so.6 Saved corefile /tmp/core-myapp.280 Analysing Core Dumps
A cross gdb can be used to analyse a core file. Additionally to the core dump gdb needs the executable and all linked static object files. One can use the OpenEmbedded built cross gdb and the target sysroot for that. Copy the core file to your development PC into the OpenEmbedded sysroot and use gdb to do the analysis: In oe-core/build/out-glibc/sysroot/colibri-t30:
../x86_64-linux/usr/bin/armv7ahf-vfp-neon-angstrom-linux-gnueabi/arm-angstrom-linux-gnueabi-gdb -ex 'set sysroot .' -ex 'core-file ./core-firefox-4-0-0-596-1402701200' usr/lib/firefox/firefox