- How to Get CPU Usage of One Single Process in Linux
- ps vs top Commands Approaches to Linux CPU Usage
- ps Command Take on CPU Usage
- top Command Take on CPU Usage
- Find CPU Usage of Singe Process Using ps Command
- Find CPU Usage of Singe Process Using top Command
- Find Processes Using Most CPU Linux
- Find Processes Using Most CPU Linux
- Top command (Table of Process or TOP)
- ps Command (Process Status)
- htop Command
- Sar Command
- iostat Command
- vmstat command
- nmon Command
- mpstat and Other Tools
- GUI tools to Find Process Using Most CPU in Linux
- Conclusion
- About the author
- Prateek Jangid
How to Get CPU Usage of One Single Process in Linux
Living in the Linux operating system world gives you the computing power and exposure to achieve computing perfection either as a superuser or a Linux administrator. One aspect of Linux operating system administration and computation that we must all strive to conquer is resource management.
Resource management in Linux operating systems irrevocably intertwines with process management. When we run/install application packages in a Linux OS environment, resources such as CPU cores for computation and memory are assigned to that running application via system/application processes.
Therefore, it is often important to know which running process is using which resource and for how long. This article will take a closer look at two Linux commands (ps and top) that are sufficient enough in retrieving the CPU usage per system process either instantaneously or periodically.
ps vs top Commands Approaches to Linux CPU Usage
It is easy to use these two commands to print the CPU usage of all processes. Before demonstrating their prowess in outputting the CPU usage of a single process, we should first understand how these two processes calculate or come up with CPU usage data.
ps Command Take on CPU Usage
Its interpretation of a process’s CPU usage is the percentage of time spent by the running process on the CPU to the period the process terminates.
top Command Take on CPU Usage
Its interpretation of a process’s CPU usage is by referencing the last screen update in relation to the calculated and elapsed CPU time as a percentage of the CPU’s total time.
Therefore, regardless of these two commands expressing a process’s CPU usage value as a percentage, their interpretation is different.
Find CPU Usage of Singe Process Using ps Command
The first step is to list all the running processes so as to identify/single out the one whose CPU usage will be of interest to us. To view all running processes on your Linux system, execute the following command:
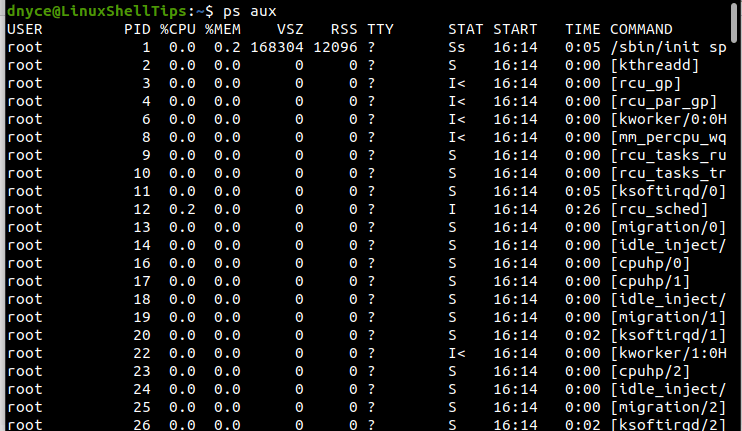
The COMMAND column on the far right lists the names of all running processes. To determine the CPU usage of a running/single process via the ps command, we will adhere to the following command syntax:
For instance, the % CPU Usage of a process will yield the following results.
$ ps -C rcu_sched -o %cpu

If a process is not consuming any CPU time, you will get an output like the following.
Find CPU Usage of Singe Process Using top Command
The first step is to get a glimpse of all running processes. The most resource-heavy processes will top the list.
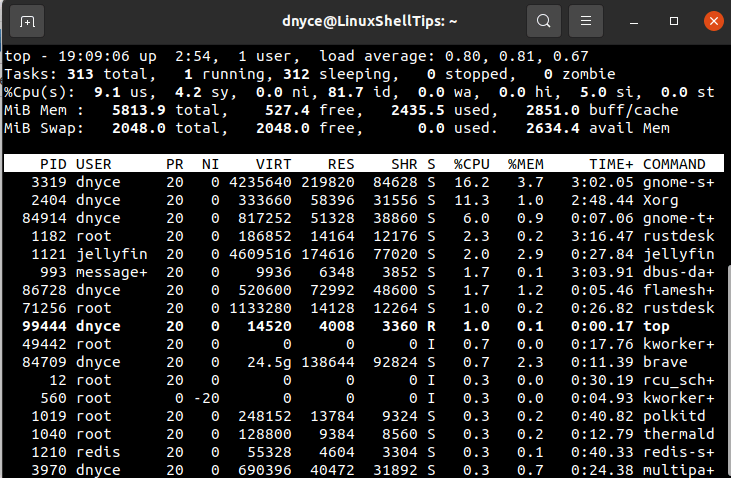
The PID column on the far-left displays the process ID and the COMMAND column on the far-right displays the associated names of the running processes.
To determine the CPU usage of a single process using top command, we will reference the following syntax.
For example, the CPU Usage stats for the Xorg process with PID (process ID) 2404 can be retrieved with the following command:
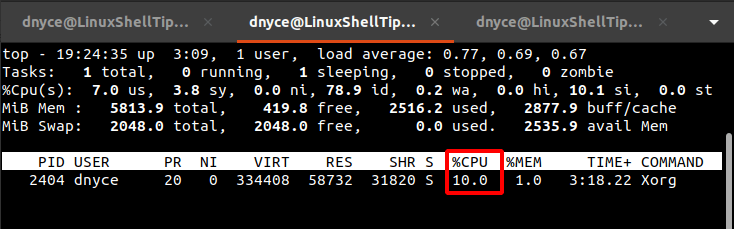
The above process stats will continuously change in real-time.
With these two flexible commands, you can now identify the CPU usage associated with each running process and determine whether to kill or leave the process running in Linux.
Find Processes Using Most CPU Linux
![]()
Many times such situations come in Linux where we have to deal with application unresponsiveness or sluggish applications due to CPU usage. This happens when our Linux system CPU is very busy. Most of the time, it has to wait until the CPU is free and queue up to process its pending requests.
Whenever the CPU is completely occupied by the processes of the Linux system, it becomes difficult for the CPU to process other requests. All remaining requests have to be stopped until the CPU is freed. This becomes a huge obstacle.
We have to use the appropriate command to know the processes which are affecting the CPU. In this article, we will tell how we can solve CPU-related problems with the help of the following commands, as well as see how to find those processes which are using most CPU Linux.
Find Processes Using Most CPU Linux
Finding CPU usage is a very important task. Linux comes with several utilities to report CPU usage.
- CPU usage
- Provide an overview of each CPU’s utilization (SMP CPUs)
- How much CPU has been used since your last reboot
- Determine what’s consuming the CPU (or CPUs)
We have many such ways with the help of which we can see the use of CPU in Linux processes.
Top command (Table of Process or TOP)
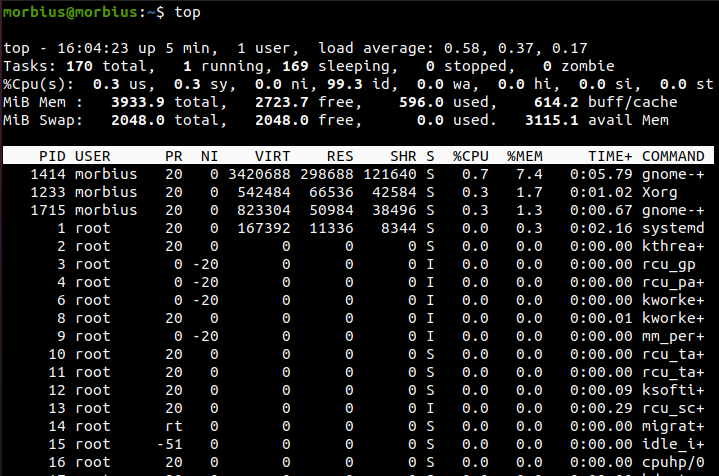
Everyone uses the top command to monitor Linux systems because it is good and well-known. By top command, the system provides a dynamic overview of the cpu usage. Top command frequently produces an updated list of top command processes. This command shows us how the CPU is using memory and processing power as well as gives information about other running processes.
The top command displays a list of tasks currently managed by the Linux kernel, as well as a complete system summary. This command monitors memory usage, process statistics and CPU usage.
Its top section contains a lot of useful information related to the overall system status, including usage statistics for both swap space and memory, CPU status, process count, load average, uptime, etc.
This list may change frequently but you can press the Q button to stop the refresh process. We can start apex using the -i switch.
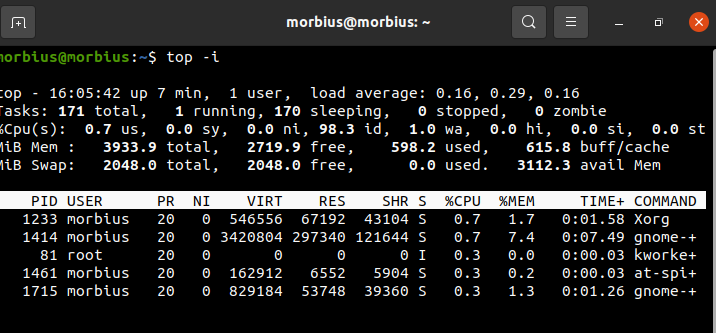
It hides all inactive processes to make it easier to sort the list. Use the following commands:
- M: Sort the task list as per the memory used by the system
- P: Sort tasks based on CPU usage
- N: Sort tasks according to processes
- T: Sort task list by run time
By default, this command sorts the top output with CPU usage by updating the top command data every 5 seconds.
For the purpose of further analysis, it is best to have a clear view of top’s output after running it in batch mode. Using the top command, you can find out what the CPU statistics are for Linux.
Top command performs well on multiple CPUs and in true SMP environments, the top number of CPUs. To exit from the top command display, we have to type the q key.
ps Command (Process Status)
PS command displays information about the active running processes on the system. This command provides a snapshot of current processes with detailed information like time command name, process start date, memory usage, CPU usage, user id, username etc.
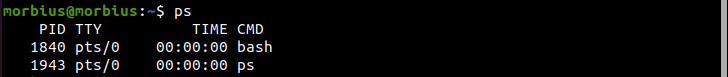
This command provides a snapshot of current processes with detailed information like time command name, process start date, memory usage, CPU usage, user id, username etc.
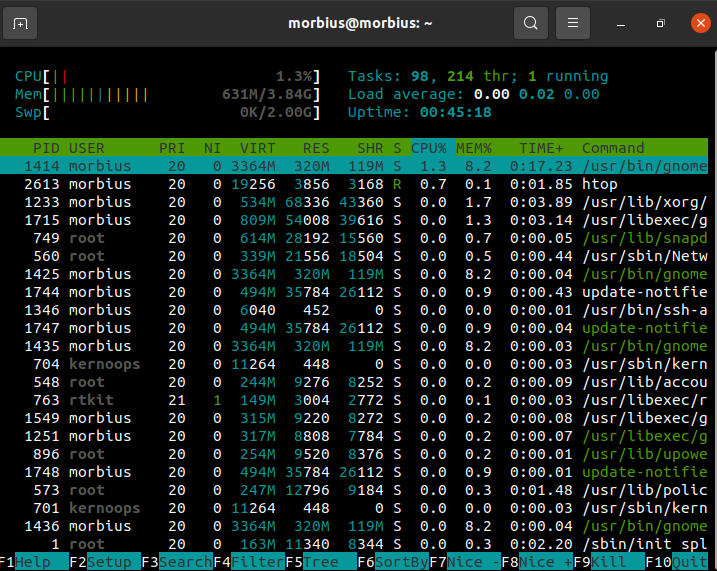
htop Command
The htop command is also similar to the top command, but one of its features is that it allows us to scroll horizontally and vertically and much more.
Sar Command
With sar command, you can view today’s CPU activity as a utility for managing system resources.
The -u option allows you to track CPU performance, but it is not limited exclusively to CPU usage.
You can print the standard output by the sar command on selected cumulative activity counters in the OS. It gives output based on interval and calculation parameters. For example, 2 seconds apart; 5 times, use:
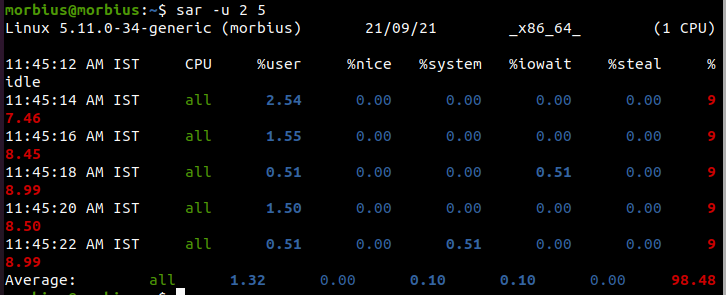
Display CPU usage with the –u option. Whenever it displays, it should do so every five seconds. You can cancel this by pressing Ctrl-C.
Here, U12 5 displays the following values of CPU usage.
- % user: Displaying CPU usage while executing at the application and user level.
- %nice: Showing CPU usage for the user while an application is running.
- %system: Displaying CPU usage while executing at the (kernel) system level.
- %iowait: This measure tracks the amount of idle time over which the system has outstanding disk I/O requests.
- %idle: It shows the percentage of time when CPUs or CPUs are idle and during which the system did not have outstanding I/O disk requests.
The output file has to be set for multiple reports and multiple samples to get the report from the Sar command. Run this command as a background process.

Even after logging out, if we want to see the report back, then we can better use the nohup command.

This file contains binary copies of all the data contained in the file. Using the -f option, you can display this data with the sar command.
Find out who is consuming CPUs or monopolizing them. In the end, we determine which process is consuming and monopolizing the CPU. The following commands display the top 10 CPU users on Linux systems.

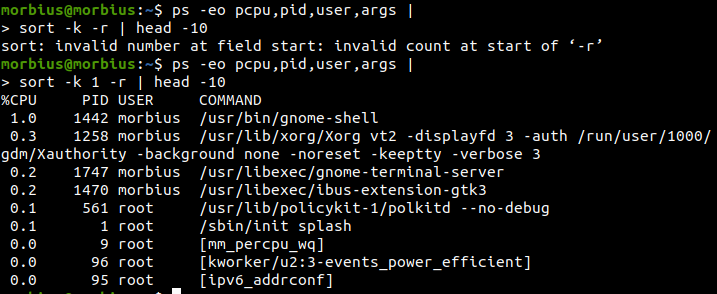
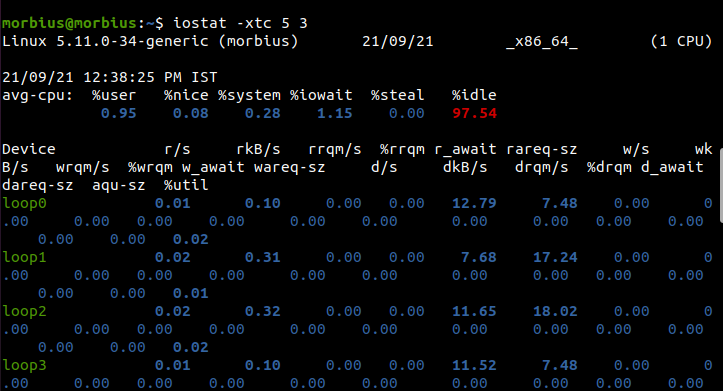
iostat Command
This command is used to find the average usage of the system since the last reboot. By using the iostat command, we report the partitions, devices and data of the CPU (Central Processing Unit).

If we use the command given below, we will get 3 outputs every 5 seconds.
vmstat command
With vmstat, you can check CPU, disk, IO, memory, traps, processes, and more. This command goes something like this.
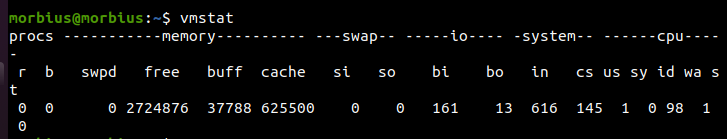
The percentages represent the time spent on each CPU core.
- us: Runtime for non-kernel code.
- sy: Duration of kernel execution.
- id: The number of idle minutes.
- wa: Waiting time for I/O.
- st: Time stolen from a virtual machine.
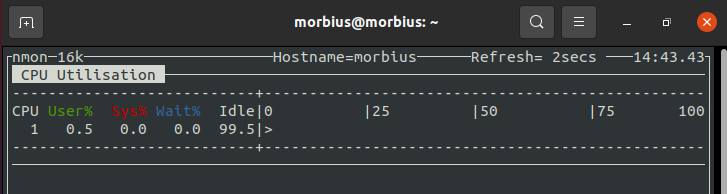
nmon Command
Nigel Griffiths of IBM developed the monitoring tool Nmon. Follow these instructions to install the monitoring tool Nmon:
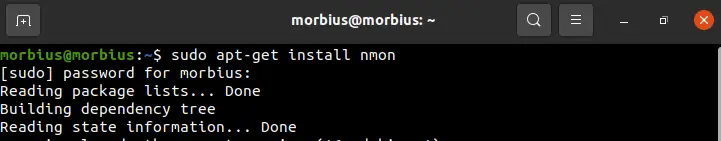
Enter the following information to install CentOS:
Launching nmon requires the following command:

There are different keys for different options as you can see in the image given below:
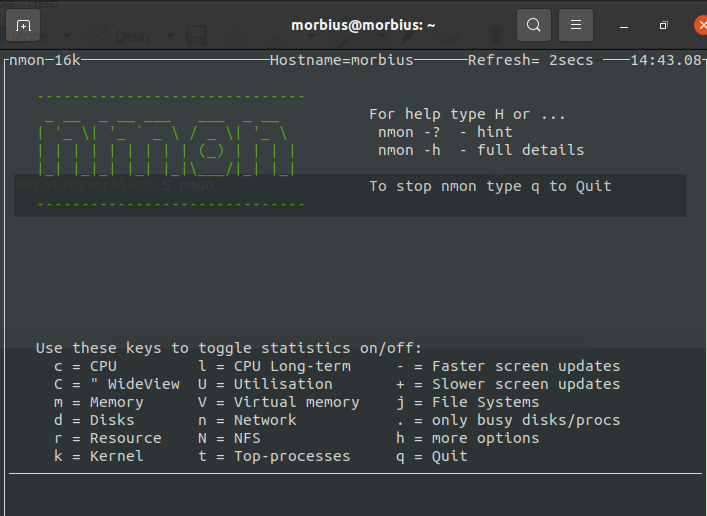
You can press the Q button to exit the tool.
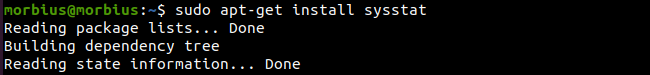
mpstat and Other Tools
To utilize these features we must first install a systat package. Default tools and system performance tools such as RHEL / Red Hat Linux are included in this package for Linux. We can install it on Ubuntu or Debian by the following command:
To install sysstat for different versions of Linux, we have to use the command according to them.
up2date command for CentOS/RHEL Linux v4.x or older
yum command for Oracle/RHEL/CentOS Linux v5.x+ or newer
dnf command for Fedora users
By using mpstat, display the use of each CPU individually. If we use multiple CPU and SMP systems, then we use mpstat command to display the usage of different CPUs. This command provides us with the report of statistics related to the processor.
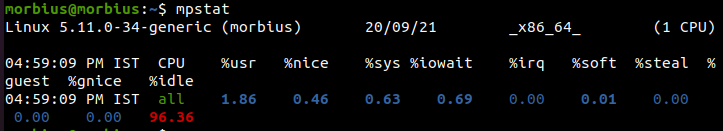
Process 0 is the first available processor, and mpstat displays activity for each one. The mpstat command is used on both UP and SMP machines, but the latter will print only the global average of activities.
- %usr: CPU utilization at the user level
- %nice: CPU usage for “nice” processes
- %sys: CPU usage on the kernel (system-level)
- %iowait: CPU idle while disk read/write occurs
- %irq: CPU usage during hardware interruptions
- %soft: Handling software interrupts with CPU usage
- %steal: CPU usage forced to wait for another virtual processor to finish handling
- %guest: Processor usage while a virtual processor is running
- %idle: CPU usage during idle time (no processes running, and no disk read/write waiting)
GUI tools to Find Process Using Most CPU in Linux
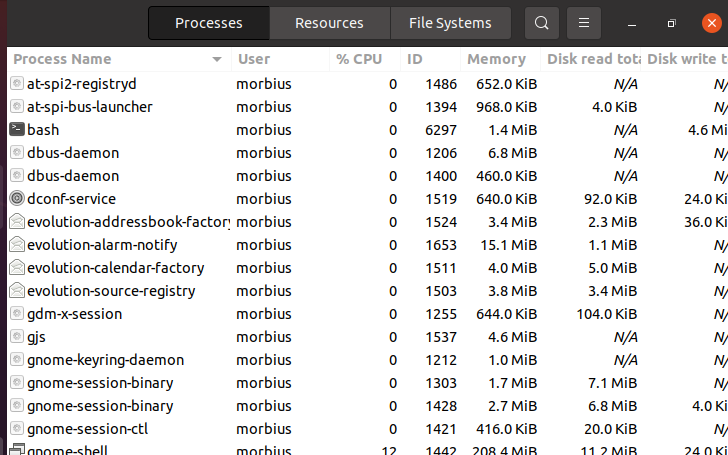
The above tool/command is very useful for remote servers. We can try gnome-system-monitor with X GUI for local systems. It lets us monitor and control the system’s processes. Through this, we can terminate processes, send signals, and access memory maps.
Additionally, gnome-system-monitor shows us an overall view of resource usage on our system including CPU and memory allocation.
Conclusion
In this article we have given information about many Linux command line tools. Through all these commands, we can see how we can find out the maximum usage of CPU and stop it. Through this, we can stop its usage and move forward the second processing of CPUs.
About the author
Prateek Jangid
A passionate Linux user for personal and professional reasons, always exploring what is new in the world of Linux and sharing with my readers.