- Sysadminium
- Что такое Load Average
- Как посмотреть Load Average
- Как рассчитывается Load Average
- Как анализировать его значение
- Итог
- What is Load Average in Linux?
- Basics of Load Average in Linux
- Getting familiar with the Load Average in Linux
- How to Check the Load Average in Linux
- 1. Using uptime command
- 2. Using top command
- 3. Using glances tool
- Wrapping up
Sysadminium
Load average — показатель средней загруженности системы Linux. Из статьи вы узнаете что можно узнать о системе смотря на этот показатель.
Что такое Load Average
Load Average (LA) — это показатель, который показывает среднюю нагрузку на сервер за определённый период времени. Чем его значение ниже, тем ниже нагрузка на сервер. В системах Linux этот показатель автоматически рассчитывается за 1, 5 и 15 минут ядром системы.
Под средней нагрузкой на сервер понимают суммарную нагрузку процессами на центральный процессор и подсистему ввода/вывода за определённый промежуток времени.
Этот показатель может сказать нам, когда наш сервер хорошо нагружен, совсем не нагружен или нагружен слишком сильно. Также, смотря на него можно понять, растёт ли нагрузка, снижается, или остаётся без изменений.
Как посмотреть Load Average
Вы уже должны быть знакомы с Load Average. Его значение за 1 минуту, за 5 минут и за 15 минут показывают уже рассмотренные ранее утилиты top и htop.
Также вы можете увидеть этот показатель выполнив команду uptime:
alex@deb-11:~$ uptime 11:50:56 up 8 days, 22:25, 1 user, load average: 0,01, 0,01, 0,00
И ещё, вы можете прочитать информацию из файла /proc/loadavg:
alex@deb-11:~$ cat /proc/loadavg 1.00 1.00 1.00 2/130 15013
Первые три числа это значение Load Average.
Четвертое поле состоит из двух чисел, разделенных косой чертой. Первое из них — это количество выполняющихся в данный момент процессов. Значение после косой черты — это количество процессов, которые в настоящее время существуют в системе.
Пятое поле — это PID процесса, который был создан в системе последним.
Как рассчитывается Load Average
Максимальным пределом для Load Average обычно считается количество ядер на сервере, которые способны обрабатывать процессы. Например, если на сервере суммарно 16 ядер, то одновременно на нём может выполняться 16 процессов. И это означает, что если:
- LA< 16, значит всё хорошо.
- LA = 16, значит сервер работает без задержек, но запаса на нём уже нет.
- LA > 16, процессам приходится ждать, значит сервер будет работать с задержками.
Какие же процессы нагружают систему:
- которые уже обрабатываются на процессоре (running);
- только готовые обрабатываться (runnable);
- обратившиеся к подсистеме ввода/вывода и читающие или пишущие туда информацию (uninterruptible sleep).
Первые два вида процессов — это нагрузка на процессор, а последний — это нагрузка на подсистему ввода вывода (обычно нагрузка на диск или сетевой ресурс).
Напомню, что процессы, которые обрабатываются на процессоре, или готовы обрабатываться в выводе ps обозначаются статусом R (running or runnable). А процессы в состоянии uninterruptible sleep обозначаются буквой D. Посмотреть такие процессы в определённый момент времени, можно выполнив команду:
alex@deb-11:~$ ps ax -o pid,comm,state | egrep 'R$' || 'D$' 14758 md5sum R 14816 ps R
А если хотите понаблюдать за изменениями, то воспользуйтесь утилитой watch:
alex@deb-11:~$ watch 'ps ax -o pid,comm,state | egrep 'R$' || 'D$'' Every 2,0s: ps ax -o pid,comm,state | egrep R || D deb-11: Wed Oct 5 14:08:08 2022 14758 md5sum R 14850 ps R 14851 sh R
И не забывайте что Load Average — это среднее значение. Представим что за минуту процессор обработает 5 циклов (это не примерно, так просто легче считать):
- 1 цикл — 2R
- 2 цикл — 5R
- 3 цикл — 2R + 1D
- 4 цикл — 16R
- 5 цикл -2R
Получается что в этом случае LA = (2 + 5 + 3 + 16 + 2) / 5 = 5,6. Для 16 ядерного процессора, вполне нормально. Но для 4 ядерного — плохо.
Как анализировать его значение
Load Average показывает 3 числа. Первое это средняя нагрузка за 1 минуту, второе — за 5 минут, а третье — за 15 минут. Поэтому, если первое число больше чем второе и третье, значит нагрузка в данный момент растёт. И наоборот, если третье число самое большое, второе поменьше, а первое ещё меньше — значит нагрузка на сервере была высокой, но уже упала.
- 6,15 5,6 3,2 — нагрузка растет;
- 2,02 5,13 8,52 — нагрузка падает;
- 3,18 3,25 3,20 — нагрузка почти не меняется.
Если значение LA меньше чем число ядер, значит сервер справляется со своими задачами. При этом могут быть недолгие колебания, когда LA становится больше числа ядер.
А если Load Average, на протяжении всей работы сервера, равен количеству ядер сервера. Это значит, что сервер работает на пределе, но при этом справляется со своей работой. Проблема в этом случае заключается только в том, что нет запаса по производительности. Какое-то приложение на сервере обновится, или вы установите новое приложение и сервер начнёт подтормаживать. Поэтому, в этом случае, можно уже подумать над оптимизацией или апгрейдом сервера.
Ну и если вы заметили что на вашем сервере средняя нагрузка выше чем его количество ядер. Значит сервер работает с тормозами. То есть одни процессы, постоянно ждут других и выполняются с запозданием. Значит пора менять сервер, или производить действия по его оптимизации.
Также, бывают ситуации, при которых Load Average может резко начать подниматься. Например, LA может быть постоянно в районе 6, и вдруг поднимется до 100. Обычно такое случается, когда на сервере что-то пошло не по плану. Например, сервер обращается к сетевому ресурсу, а тот недоступен, при этом процессы уходят в состояние uninterruptible sleep, тем самым повышая LA.
Итог
Мы познакомились поближе с определением Load Average для Linux систем. Узнали как смотреть это значение и как анализировать нагрузку на сервер.
What is Load Average in Linux?

While we believe that this content benefits our community, we have not yet thoroughly reviewed it. If you have any suggestions for improvements, please let us know by clicking the “report an issue“ button at the bottom of the tutorial.
Load Average in Linux is a metric that is used by Linux users to keep track of system resources. It also helps you monitor how the system resources are engaged. While Load Average is one of the most fundamental metrics of resource usage, the metric is pointless unless you understand what it tells a user. In this tutorial, we will help you understand what Load Average in Linux means. Further, we will discuss some easy methods to monitor the load average for your system.
Basics of Load Average in Linux
To understand the Load Average in Linux, we need to know what do we define as load. In a Linux system, the load is a measure of CPU utilization at any given moment. It refers to the number of processes which are either currently being executed by the CPU or are waiting for execution. An idle system has a load of 0. With each process that is being executed or is on the waitlist, the load increases by 1. On its own, the load doesn’t give any useful information to the user. The load can change in split seconds. This is because the number of processes using or waiting for the CPU time doesn’t remain constant. This is why we use Load Average in Linux to monitor resource usage.
Getting familiar with the Load Average in Linux

Load average, as the name suggests, depicts the average load on a CPU for a set time interval. These values are the number of processes waiting for the CPU or using it in the given period. While most people are used to the load percentages shown in Windows systems, Load Average in Linux is depicted as three different decimal values. Have look at the image above where it says “load average: 0.03, 0.03, 0.01”Going left to right:
- The first value depicts the average load on the CPU for the last minute.
- The second gives us the average load for the last 5-minute interval
- The third value gives us the 15-minute average load
This helps a user get an idea of how the CPU is being utilized by the processes on a system over time.
While a load of 1 can mean approximately 100% resource usage on a single processor system, such systems are practically non-existent today. Unless you haven’t upgraded your system in over a decade, your system should run on a multi-core processor.
For a dual-core processor, a load of 1 means that 1 core was 100% idle. This translates to approximately 50% CPU usage. Similarly, it would represent 25% CPU usage for a quad-core processor.
Load Average in Linux takes into account the waiting threads and tasks along with processes being executed. Also, it is an average value instead of being an instantaneous value.
However, an approximate idea of resource usage can be determined by the ratio of Load Average over the number of cores of your processor. While it is not an exact value for the CPU utilization at any given time, it can be helpful for resource monitoring.
How to Check the Load Average in Linux
Now that we know what Load Average represents, we will discuss a few ways to check the Load Average in Linux. Load Average can be looked up in three common ways.
1. Using uptime command
The uptime command is one of the most common methods for checking the Load Average for your system. To use the uptime command, we simply open the command line and type the following.
This displays the amount of time that our system has been up for, along with the number of active users and the Load Average for our system. The following screenshot shows what should you see when you use the uptime command on your system.
As you can see, the load average for the last minute is 0.03. For the last five minutes and fifteen minutes, the Load Average values are 0.03 and 0.01 respectively.
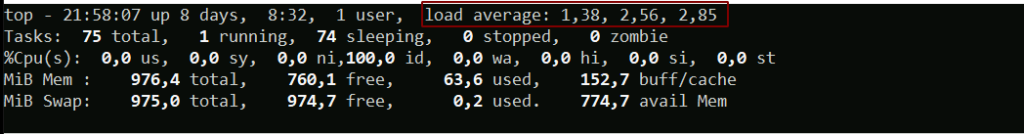
2. Using top command
Another way to monitor the Load Average on your system is to utilise the top command in Linux. To do so, simply open the terminal and type this.
This will open the top interface in your terminal. Unlike the uptime command, this gives an in-depth view of the resource usage for your system.
The following screenshot shows what should you see when you use the top command on your system.
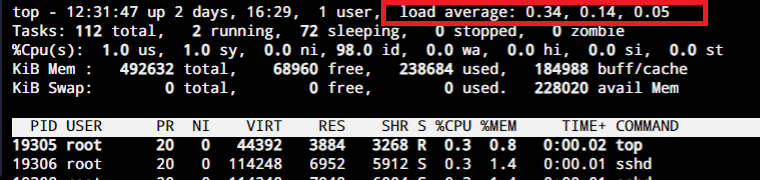
As you can see in the top-most line, the load average for the last minute is 0.34. For the last five minutes and fifteen minutes, the Load Average values are 0.14 and 0.405 respectively.
3. Using glances tool
The glances tool is a system monitoring tool which works similar to the top command. It gives a detailed overview of the system resource usage. To use the glances tool on your system, you need to install its package using this command.
sudo apt-get install glances Once you are done with the installation, type the following in your terminal.
This will open the glances interface in your terminal. Unlike the top command, this gives the number of processor cores available along with the Load Average for your system.
The following screenshot shows what should you see when you use the glances command on your system.
As you can see in the highlighted region, the load average for the last minute is 0.14. For the last five minutes and fifteen minutes, the Load Average values are 0.12 and 0.05 respectively.
Wrapping up
The Load Average in Linux is an essential metric to monitor the usage of system resources easily. Keeping the load average in check helps ensure that your system does not experience a crash or sluggish sessions.
We hope this tutorial was able to help you to get familiar with the concept of Load Average in Linux.
Thanks for learning with the DigitalOcean Community. Check out our offerings for compute, storage, networking, and managed databases.