- Processes in Linux
- How to view all running processes?
- How to find a particular process?
- How to kill/stop a particular process?
- Finding out list of open files
- Signals
- top command
- Load average
- htop tool
- More about Linux processes
- /proc directory
- /proc/cpuinfo
- /proc/cmdline
- /proc/meminfo
- /proc/uptime
- /proc/sys/ & sysctl command
- Enabling IP forward with sysctl
- Table of Contents
- Related Topics
- How to see detailed information about a given PID?
- 3 Answers 3
Processes in Linux
A process is a program (think about any Linux application) in a running state. It contains various details, like the memory space the program needs, a process id, the files opened by the process, etc.
How to view all running processes?
The following command shows all the processes from your computer.
$ ps aux USER PID %CPU %MEM VSZ RSS TTY STAT START TIME COMMAND root 1 0.0 0.0 215356 4984 ? Ss May29 0:28 /usr/lib/systemd/systemd --system --deserialize 19 root 2 0.0 0.0 0 0 ? S May29 0:00 [kthreadd] root 4 0.0 0.0 0 0 ? S< May29 0:00 [kworker/0:0H] root 6 0.0 0.0 0 0 ? S May29 0:11 [ksoftirqd/0] root 7 0.0 0.0 0 0 ? S May29 8:27 [rcu_sched] . long output
You can see that the output also tells you under which user the process is running, what the actual command being used is, and the percentage of CPU and memory usage.
The PID column shows the process id; you can see that the systemd process has PID 1, which means it is the first process to start in the system.
How to find a particular process?
Let’s say, I want to know the process id of the Firefox browser in my system. I can use the following command to find that information.
$ ps aux | grep firefox kdas 26752 96.1 9.7 2770724 763436 ? Sl 16:16 0:35 /usr/lib64/firefox/firefox kdas 26919 0.0 0.0 118520 980 pts/3 S+ 16:17 0:00 grep --color=auto firefox
Here, we are first running the ps command, and then passing the output of that to the next command using the | character. In this case, as you see, grep is that second command. We can find and look for text using the grep tool. We will learn more about grep in the future.
How to kill/stop a particular process?
We can kill/stop any process using the kill command. We found out, in the last example, that the id of the Firefox process in my computer is 26752, we can use that id to kill it.
If there is no error message, you’ll find that Firefox has disappeared.
Finding out list of open files
lsof command will show list of all open files. The man page has more details about the different command line options available.
Signals
Signals are a limited way to communicate to a process. You can think about them as notifications to a process, and depending on the signal handler in the code, the process does something with that signal. The kill command actually sends a signal to the given process id, the default signal is TERM, which says to terminate the process. To directly/forcibly kill a process, you can send the KILL signal.
Here 9 is number representation of the KILL signal. To know more about Linux signals, read the man page.
kill command also has a -l flag, which prints all of the signal names, and numbers on the screen.
$ kill -l 1) SIGHUP 2) SIGINT 3) SIGQUIT 4) SIGILL 5) SIGTRAP 6) SIGABRT 7) SIGBUS 8) SIGFPE 9) SIGKILL 10) SIGUSR1 11) SIGSEGV 12) SIGUSR2 13) SIGPIPE 14) SIGALRM 15) SIGTERM 16) SIGSTKFLT 17) SIGCHLD 18) SIGCONT 19) SIGSTOP 20) SIGTSTP 21) SIGTTIN 22) SIGTTOU 23) SIGURG 24) SIGXCPU 25) SIGXFSZ 26) SIGVTALRM 27) SIGPROF 28) SIGWINCH 29) SIGIO 30) SIGPWR 31) SIGSYS 34) SIGRTMIN 35) SIGRTMIN+1 36) SIGRTMIN+2 37) SIGRTMIN+3 38) SIGRTMIN+4 39) SIGRTMIN+5 40) SIGRTMIN+6 41) SIGRTMIN+7 42) SIGRTMIN+8 43) SIGRTMIN+9 44) SIGRTMIN+10 45) SIGRTMIN+11 46) SIGRTMIN+12 47) SIGRTMIN+13 48) SIGRTMIN+14 49) SIGRTMIN+15 50) SIGRTMAX-14 51) SIGRTMAX-13 52) SIGRTMAX-12 53) SIGRTMAX-11 54) SIGRTMAX-10 55) SIGRTMAX-9 56) SIGRTMAX-8 57) SIGRTMAX-7 58) SIGRTMAX-6 59) SIGRTMAX-5 60) SIGRTMAX-4 61) SIGRTMAX-3 62) SIGRTMAX-2 63) SIGRTMAX-1 64) SIGRTMAX
top command
top is a very useful command while using a Linux system. It’s a quick way to know about all the running processes in the system, and their related status about CPU and memory usage in general. To get out of top, press the key q.
top - 17:37:28 up 24 days, 11:52, 2 users, load average: 0.57, 0.73, 0.75 Tasks: 372 total, 2 running, 370 sleeping, 0 stopped, 0 zombie %Cpu(s): 11.6 us, 2.6 sy, 0.0 ni, 84.9 id, 0.1 wa, 0.3 hi, 0.5 si, 0.0 st KiB Mem : 7858752 total, 1701052 free, 4444136 used, 1713564 buff/cache KiB Swap: 3268604 total, 1558396 free, 1710208 used. 2431656 avail Mem PID USER PR NI VIRT RES SHR S %CPU %MEM TIME+ COMMAND 28300 kdas 20 0 1502016 287340 44396 R 25.0 3.7 290:56.60 chrome 2668 kdas 9 -11 2067292 9756 7164 S 6.2 0.1 166:06.48 pulseaudio 15122 kdas 20 0 771844 33104 11352 S 6.2 0.4 39:24.60 gnome-terminal- 24760 kdas 20 0 1945840 209128 76952 S 6.2 2.7 1:41.15 code 27526 kdas 20 0 156076 4268 3516 R 6.2 0.1 0:00.01 top 1 root 20 0 215356 4880 3108 S 0.0 0.1 0:28.25 systemd 2 root 20 0 0 0 0 S 0.0 0.0 0:00.66 kthreadd 4 root 0 -20 0 0 0 S 0.0 0.0 0:00.00 kworker/0:0H 6 root 20 0 0 0 0 S 0.0 0.0 0:11.79 ksoftirqd/0 7 root 20 0 0 0 0 S 0.0 0.0 8:28.06 rcu_sched . long output
By the way, feel free to press 1 and see if anything changes in the top command output.
Load average
If you look at the top output carefully, you will find load average mentioned. Actually, there are 3 numbers provided; these are the load averages of the system in the last one minute, 5 minutes ago, and 15 minutes ago.
In simple words, load average means the average time any process has to wait to get access to the CPU (or other resources), in idle state the load average is 0. This information is a quick way to learn about the system, if the system is slow to respond, just looking at the load-average, and then the rest of the top output should be a good starting point.
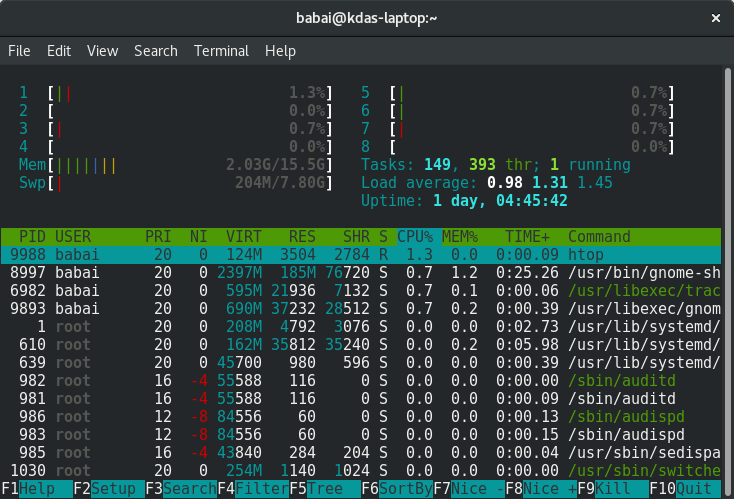
htop tool
htop is a modern version of the top tool. It has many more features, interactiveness being the biggest amongst them. htop does not come by default in most of the Linux installations, which means you will have to install it using the system’s package management tool.
These are the ways to install it in Fedora and in Debian/Ubuntu
To know more about htop, please read the man page.
More about Linux processes
You can learn more about Linux processes in the glibc manual. Use the info command to find out more.
/proc directory
/proc is a special directory in our filesystem. This is a virtual filesystem which contains information about all the running processes, and information about the hardware present in the system. You will find that the files in the virtual filesystem are 0 in size.
Now we’ll learn about a few files inside this directory.
/proc/cpuinfo
/proc/cpuinfo file has information about the CPU in your system. It includes the model number, and also the various flags available in that particular CPU model.
/proc/cmdline
/proc/cmdline file has all the parameters passed to the kernel at the bootup time. The following is a cloud-based virtual machine.
$ cat /proc/cmdline BOOT_IMAGE=/boot/vmlinuz-4.8.6-300.fc25.x86_64 root=UUID=9be70055-35f2-4a57-b120-5a003dfdb504 ro no_timer_check console=tty1 console=ttyS0,115200n8 rhgb quiet console=ttyS1 LANG=en_US.UTF-8 initrd=/boot/initramfs-4.8.6-300.fc25.x86_64.img
/proc/meminfo
/proc/meminfo contains information related to the memory in the system. You can see the total amount RAM, the available memory and other values there.
$ cat /proc/meminfo MemTotal: 4046820 kB MemFree: 2960568 kB MemAvailable: 3696216 kB Buffers: 53756 kB Cached: 830052 kB SwapCached: 0 kB Active: 347216 kB Inactive: 575692 kB Active(anon): 39388 kB Inactive(anon): 196 kB Active(file): 307828 kB Inactive(file): 575496 kB Unevictable: 0 kB Mlocked: 0 kB SwapTotal: 0 kB SwapFree: 0 kB Dirty: 4 kB Writeback: 0 kB AnonPages: 39120 kB Mapped: 42032 kB Shmem: 488 kB Slab: 141692 kB SReclaimable: 114996 kB SUnreclaim: 26696 kB KernelStack: 1360 kB PageTables: 2700 kB NFS_Unstable: 0 kB Bounce: 0 kB WritebackTmp: 0 kB CommitLimit: 2023408 kB Committed_AS: 127752 kB VmallocTotal: 34359738367 kB VmallocUsed: 0 kB VmallocChunk: 0 kB HardwareCorrupted: 0 kB AnonHugePages: 0 kB ShmemHugePages: 0 kB ShmemPmdMapped: 0 kB CmaTotal: 0 kB CmaFree: 0 kB HugePages_Total: 0 HugePages_Free: 0 HugePages_Rsvd: 0 HugePages_Surp: 0 Hugepagesize: 2048 kB DirectMap4k: 61296 kB DirectMap2M: 4132864 kB DirectMap1G: 2097152 kB
/proc/uptime
$ cat /proc/uptime 52820.32 104802.84
The first value in this file shows the number of seconds the system is up. The second value is the total number of idle seconds for each CPU, so for the modern systems, this value can be more than the first value.
/proc/sys/ & sysctl command
This directory is a special one for system administrators. This not only provides information, but also allows you to quickly change (enable/disable) different kernel features.
We use the sysctl command to view or edit the values for /proc/sys/. If you want to see all the different settings, use the following command.
$ sudo sysctl -a [sudo] password for kdas: abi.vsyscall32 = 1 crypto.fips_enabled = 0 debug.exception-trace = 1 debug.kprobes-optimization = 1 dev.cdrom.autoclose = 1 dev.cdrom.autoeject = 0 dev.cdrom.check_media = 0 dev.cdrom.debug = 0 dev.cdrom.info = CD-ROM information, Id: cdrom.c 3.20 2003/12/17 . long output
Enabling IP forward with sysctl
To enable IP forwarding to the VM(s), use the following command.
$ sudo sysctl -w net.ipv4.ip_forward=1
To check the current value, use the following command.
You can see the same value in the /proc/sys/net/ipv4/ip_forward file too.
$ cat /proc/sys/net/ipv4/ip_forward 1
To make the change permanent, write the following in the /etc/sysctl.conf file.
Then, enable the changes using the following command.
$ sudo sysctl -p /etc/sysctl.conf

Linux command line for you and me is a book for newcomers to command line environment.
Table of Contents
- Processes in Linux
- How to view all running processes?
- How to find a particular process?
- How to kill/stop a particular process?
- Finding out list of open files
- Signals
- top command
- Load average
- htop tool
- More about Linux processes
- /proc directory
- /proc/cpuinfo
- /proc/cmdline
- /proc/meminfo
- /proc/uptime
- /proc/sys/ & sysctl command
- Enabling IP forward with sysctl
Related Topics
How to see detailed information about a given PID?
The headline basically says it all. I have a program where I am only given the PID, nothing more really, and I would like to know how I get more information about the given process.
If you are working in python you probably want to use the psutil library. Do: psutil.Process(pid) to obtain the process object and then use its interface to retrieve information about memory/cpu etc. etc.
3 Answers 3
will show you some information. See the ps manpage for more information about the ps command. The "STANDARD FORMAT SPECIFIERS" section explains what the different columns mean.
I don't know what is your exact requirement. but this may help you.
There is separate directory for every process with name as pid number in /proc .
ps -ef | grep docker root 1700 1 0 Sep20 ? 00:03:04 /usr/bin/docker daemon --raw-logsIn above output PID is 1700 .
ls attr clear_refs cpuset fd limits mem net oom_score projid_map sessionid stat task autogroup cmdline cwd fdinfo loginuid mountinfo ns oom_score_adj root setgroups statm timers auxv comm environ gid_map map_files mounts numa_maps pagemap sched smaps status uid_map cgroup coredump_filter exe io maps mountstats oom_adj personality schedstat stack syscall wchanthere is many file that have all information about process.
cat /proc/1700/status Name: docker State: S (sleeping) Tgid: 1700 Ngid: 0 Pid: 1700 PPid: 1 TracerPid: 0 Uid: 0 0 0 0 Gid: 0 0 0 0 FDSize: 64 Groups: 0 999 VmPeak: 527576 kB VmSize: 527512 kB VmLck: 0 kB VmPin: 0 kB VmHWM: 46032 kB VmRSS: 34180 kB VmData: 449308 kB VmStk: 136 kB VmExe: 28324 kB VmLib: 4236 kB VmPTE: 296 kB VmSwap: 5324 kB Threads: 12 SigQ: 0/63662 SigPnd: 0000000000000000 ShdPnd: 0000000000000000 SigBlk: 0000000000000000 SigIgn: 0000000000000000 SigCgt: ffffffffffc1feff CapInh: 0000000000000000 CapPrm: 0000003fffffffff CapEff: 0000003fffffffff CapBnd: 0000003fffffffff Seccomp: 0 Cpus_allowed: f Cpus_allowed_list: 0-3 Mems_allowed: 00000000,00000001 Mems_allowed_list: 0 voluntary_ctxt_switches: 437726 nonvoluntary_ctxt_switches: 27579If you need basic command to get process information then you can easily get using command: