- Parsing Apache Web Server Logs With Command Line Tools
- Parsing Apache Logs
- Using Linux Command Line Tools
- Using AWK Command to Parse Logs
- Using Python Script for Parsing Apache Server Logs
- Count Number of Lines Matching Specific Conditions with WC
- GREP for Parsing and Searching for HTTP status codes
- Using CAT command for Parsing and Searching for HTTP status codes
- View Real-time Apache Server Logs with Tail Command
- Using Bash Shell Script for Apache Log Analysis
- OpenSource Apache Log Analyzer Tools
- Analyzing Apache logs with apachetop
- GoAccess for Real-Time Web Access Log Analysis
- View GoAccess Reports
- Using Log Management Systems
- Conclusion
- FAQ
Parsing Apache Web Server Logs With Command Line Tools
Apache web server access and error logs provide important information showing the activity being performed by the server and errors encountered in the process. Using command line tools to parse Apache web server log files is a quick way to monitor production server activity, and can also be used during development and testing and for finding errors and validating test data.
- Parsing Apache Logs
- Using Linux Command Line Tools
- Using AWK Command to Parse Logs
- Using Python Script for Parsing Apache Server Logs
- Count Number of Lines Matching Specific Conditions with WC
- GREP for Parsing and Searching for HTTP status codes
- Using CAT command for Parsing and Searching for HTTP status codes
- View Real-time Apache Server Logs with Tail Command
- Using Bash Shell Script for Apache Log Analysis
- Analyzing Apache logs with apachetop
- GoAccess for Real-Time Web Access Log Analysis
Parsing Apache Logs
Apache server reports extensive data about your website, server, user, and the resources being served. Extracting this data from these logs, stored as plain text can be done through simple command line tools built into your operating system.
This process is called log parsing, which converts the raw text produced by Apache into fields that can be indexed, searched, and analyzed. This makes it easier to oversee Apache, drill down into specific problems, or look at broader trends.
This post shows how to parse Apache logs using common command line tools, as well as info on more sophisticated log management solutions.
Shown below is an example line from the Apache web server access log .
127.0.0.1 fsm FSM [07/Nov/2022:23:08:54 +0000] "GET / HTTP/1.0" 200 14312 "https://essentialsurvival.com/" "Mozilla/5.0 (Windows NT 6.1) AppleWebKit/537.36 (KHTML, like Gecko) Chrome/90.0.4430.93 Safari/537.36"Using Linux Command Line Tools
You can use Linux command line tools to parse out information from Apache logs. For example, because Apache logs are plaintext files, you can use cat to print the contents of an Apache log to stdout . You can also use tools like grep , awk , and cut for filtering and pattern matching,
Below i will look into different methods for using Linux command lines tools to parse and view Apache web server logs.
Using AWK Command to Parse Logs
The awk command provides powerful parsing text processing capabilities for text files. The awk command uses whitespace to separate text into “columns” we can parse. $1 represents the first column, $2 the second column, and so on.
Since Apache LogFormat entries use a specific format we can use awk command to reliably parse for information, specifying various filters. As an example, if you wanted to print all the IP addresses and HTTP response codes, running the following script will provide the required information.
# awk '' /var/log/apache2/access.log198.5.4.115 403 192.4.40.12 404 192.0.11.13 405 10.0.0.115 404 10.0.0.115 404 192.168.1.3 404Awk is more useful for scripting and here are a couple of examples of how to extract particular data from the file:
awk '' access.log # ip address (%h) awk '' access.log # RFC 1413 identity (%l) awk '' access.log # userid (%u) awk '' access.log # date/time (%t) awk '' access.log # status code (%>s) awk '' access.log # size (%b)Using Python Script for Parsing Apache Server Logs
You can also use python to parse text files very easily. The first script shown below does just that but for a single log entry.
line = '192.168.1.118 - - [2/Nov/2022:13:13:13 +0800] "GET / HTTP/1.1" 200 - "" "Mozilla/5.0 (Windows NT 10.0; Win64; x64; rv:106.0) Gecko/20100101 Firefox/106.0"' regex = '([(\d\.)]+) - - \[(.*?)\] "(.*?)" (\d+) - "(.*?)" "(.*?)"' import re print re.match(regex, line).groups()The output would be a tuple with 6 pieces of information from the line:
('182.168.1.118', '2/Nov/2022:13:13:13 +0800', 'GET / HTTP/1.1', '200', '', 'Mozilla/5.0 (Windows NT 10.0; Win64; x64; rv:106.0) Gecko/20100101 Firefox/106.0')This second script is more useful where you can pass the complete file to parse all log entries for a file.
import csv import re log_file_name = "access.log" csv_file_name = "parsed.csv" parts = [ r'(?P \S+)', # host %h r'\S+', # indent %l (unused) r'(?P \S+)', # user %u r'\[(?P .+)\]', # time %t r'"(?P .+)"', # request "%r" r'(?P 6+)', # status %>s r'(?P \S+)', # size %b (careful, can be '-') r'"(?P .*)"', # referer "%i" ] pattern = re.compile(r'\s+'.join(parts)+r'\s*\Z') file = open(log_file_name) with open(csv_file_name, 'w') as out: csv_out=csv.writer(out) csv_out.writerow(['host', 'user', 'time', 'request', 'status', 'size', 'referer']) for line in file: m = pattern.match(line) result = m.groups() csv_out.writerow(result)Count Number of Lines Matching Specific Conditions with WC
The wc command with the -l option counts the total number of lines in a file. Running the command on a test file on my server I get the following.
wc -l /var/log/apache2/access.log ### Output ### 98 /var/log/apache2/access.logGREP for Parsing and Searching for HTTP status codes
Some people prefer to use a tool like grep which can extract data based on regular expressions. The example below extracts patterns of three digits surrounded by spaces. The spaces prevent a match to spurious data such as a timestamp. This will mostly be the status codes but could include false positives.
grep -o " 4 " /var/log/apache2/access.logThis will output something similar to the list below.
I find grep to be useful in cases where I am trying to find something specific.
You can also combine grep with wc to count number of lines that meet a specific condition.
grep GET /var/log/apache2/access.log | wc -lNotice that the output is only a number in this case. That’s because we didn’t provide wc a file, instead, we piped the output of grep into wc.
Using CAT command for Parsing and Searching for HTTP status codes
This is another example that uses the cat command to parse and search through log files. You can print the whole like with the text you are looking for or use cut to only look for specific text. The example below is similar to the grep example above where I search for HTTP codes.
cat access.log | cut -d ' ' -f 9The output will be similar to what is shown for grep with false positives.
Similar to the grep option I prefer not to use this unless I am trying to find something specific.
View Real-time Apache Server Logs with Tail Command
For real-time troubleshooting and debugging it is valuable to see all activity being logged to the access or error log files as requests come in. You can set up this process by using the command tail with the -f option as shown below. it’s often useful to stream the contents of a log to a terminal with the tail command.
tail -f /var/log/apache2/access.log ### This command with tail the file which will show latest log entries.You can also use the -n option to limit the lines show. The example below shows the five most recent log file entries, updating as new log entries are added.
tail -n 3 -f /var/log/apache2/access.logOutput will look similar to:
127.0.0.1 - - [12/Nov/2022:17:57:11 +0000] "POST /wp-cron.php?doing_wp_cron=1668275831.0842161178588867187500 HTTP/1.0" 200 455 "https://localhost/wp-cron.php?doing_wp_cron=1668275831.0842161178588867187500" "WordPress/6.1; https://localhost" 127.0.0.1 - - [12/Nov/2022:17:57:10 +0000] "GET /testpage HTTP/1.0" 200 11335 "-" "Mozilla/5.0 (compatible; AhrefsBot/7.0; +http://ahrefs.com/robot/)"You can further filter the output from tail by piping the result to pipe to find specific text or text patterns. Example below show how to use grep to only show log entries for HTTP GET.
tail -f /var/log/apache2/access.log | grep "GET"Using Bash Shell Script for Apache Log Analysis
Linux shells like Bash, ksh or cshell provide their own scripting languages to build scripts to do almost anything. Therefore using shell scripts you can also create your own custom command line tools to parse log files.
Using commands such as awk, grep or sed you can create your own custom shell scripts and automate those for (near) real-time reporting or for data consolidation reports.
OpenSource Apache Log Analyzer Tools
As you have seen in the examples above, using command line tools for parsing is great if you need to filter and sort using ad-hoc queries. But as your web application evolves so will your need for getting insights into the data being collected in log files.
The scope of this post is not to get into visual analysis tools or analytics tools that can identify usage patterns across pages, leaving that for a subsequent post, but to look into command line tools for Apache log parsing and data extraction.
Below I wanted to introduce you to two additional open-source tools that you can easily install that will take the log analysis process a little easier for you.
Analyzing Apache logs with apachetop
Apachetop is an open-source command line tool for analyzing Apache log files in real-time. It is not installed by default on most Linux or BSD distributions. To install Apachetop on Ubuntu:
Once installed it is easy to run the command using the following:
On a system with multiple Apache virtual hosts or if you are logging to a custom file name, use the -f option to specify a filename.
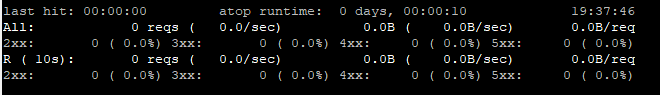
apachetop -f /var/log/apache2/mydomain.logYou output will look similar to the image below.

It’s easy to get started with apachetop, simply specify an Apache log file and watch the real-time analysis in your terminal. For example, here’s how you can use apachetop to analyze the Apache access log on a Rocky Linux system:
$ apachetop /var/log/httpd/access_logOutput should look similar to:
last hit: 00:00:00 atop runtime: 0 days, 00:00:05 22:32:27 All: 0 reqs ( 0.0/sec) 0.0B ( 0.0B/sec) 0.0B/req 2xx: 0 ( 0.0%) 3xx: 0 ( 0.0%) 4xx: 0 ( 0.0%) 5xx: 0 ( 0.0%) R ( 5s): 0 reqs ( 0.0/sec) 0.0B ( 0.0B/sec) 0.0B/req 2xx: 0 ( 0.0%) 3xx: 0 ( 0.0%) 4xx: 0 ( 0.0%) 5GoAccess for Real-Time Web Access Log Analysis
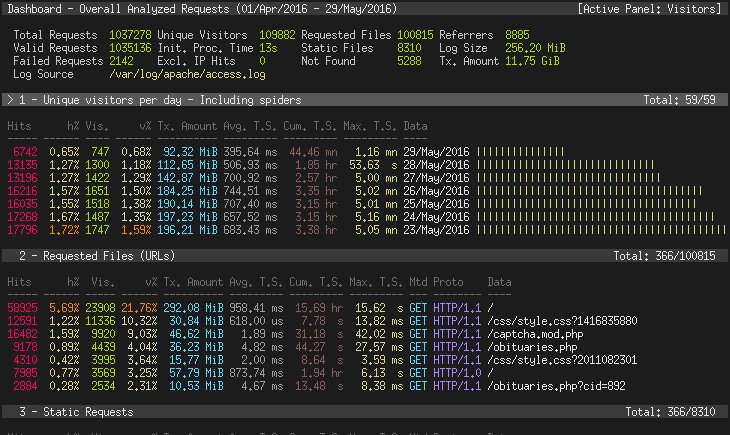
GoAccess is an open-source real-time web log analyzer and interactive viewer that runs in a terminal in Unix or Linux based systems as well as BSD.
It provides fast and valuable HTTP statistics for system administrators that require a visual server report on the fly. While the terminal output is the default viewing option, it also has the ability to provide real-time HTML output. In addition, if you prefer to feed the input into other downstream tools for automated or manual analysis the data can be saved in csv or json formats.

On Debian or Ubuntu systems, you can install it using the command:
On FreeBSD, you can install it with pkg manager:
pkg install sysutils/goaccessCheck out the GoAccess Download page for installation on other systems as well as Docker image.
View GoAccess Reports
To view, the default console-based real-time reports run the following command from your shell (note: ncurses is the only prereq).
goaccess /var/log/apache2/access.log -c ### This uses the default LogFormatTo generate a static HTML file use the following command.
goaccess access.log -o report.html --log-format=COMBINED ### the log-format option specifies the nickname ### of the LogFormatIf you want the GoAccess report to be in HTML but in real time, use the following option.
goaccess access.log -o /var/www/html/report.html --log-format=COMBINED --real-time-htmlUsing Log Management Systems
Good log management systems can parse Apache logs, and some can do it automatically while others require configuration. Tools like Logstash and Fluentd require configuration for parsing. They use grok filters, which are regular expressions to extract each field from the log line. Grok also includes a library of regular expressions to extract many formats, but you’ll have the find the right one for you.
There are some very good paid tools as well which make the job of parsing Apache logs much easier. I will be reviewing some of the options in a later post.
Conclusion
In this post I went over details of how to parse Web Server logs using various methods. You can also check my in depth post on how to parse Apache or Nginx logs using Java.
For other guides and posts on Apache check out our main Apache web server page. You will also find NGINX related posts and news on the respective page.
FAQ
Searching on google will get you to a lot of sample Apache access.log and error.log files data. Use the following Google search query to search for log files.
inurl:access.log filetype:log # For access.log files inurl:error.log filetype:log # For error.log files.