Linux basic health check commands
There are a variety of tools that a system administrator can use to check and monitor the health of their Linux system. This would include not only the physical hardware, but also the software and how many resources are being dedicated to running the installed services. In this tutorial, you will learn several commands to check overall health of your Linux system from the command line.
In this tutorial you will learn:
- How to check system processes, CPU usage, and RAM usage
- How to check hard drive diagnostics and input/output operations
- How to monitor network activity and hardware temperatures

| Category | Requirements, Conventions or Software Version Used |
|---|---|
| System | Any Linux distro |
| Software | top, htop, free, smartmontools, sysstat, lm-sensors, ss |
| Other | Privileged access to your Linux system as root or via the sudo command. |
| Conventions | # – requires given linux commands to be executed with root privileges either directly as a root user or by use of sudo command $ – requires given linux commands to be executed as a regular non-privileged user |
Linux basic health check commands
Check out the commands below to see our compiled list of the best health check tools on Linux. Most of these tools are installed by default on all major Linux distros, but we have included installation instructions for the few tools that will need to be installed via system package manager.
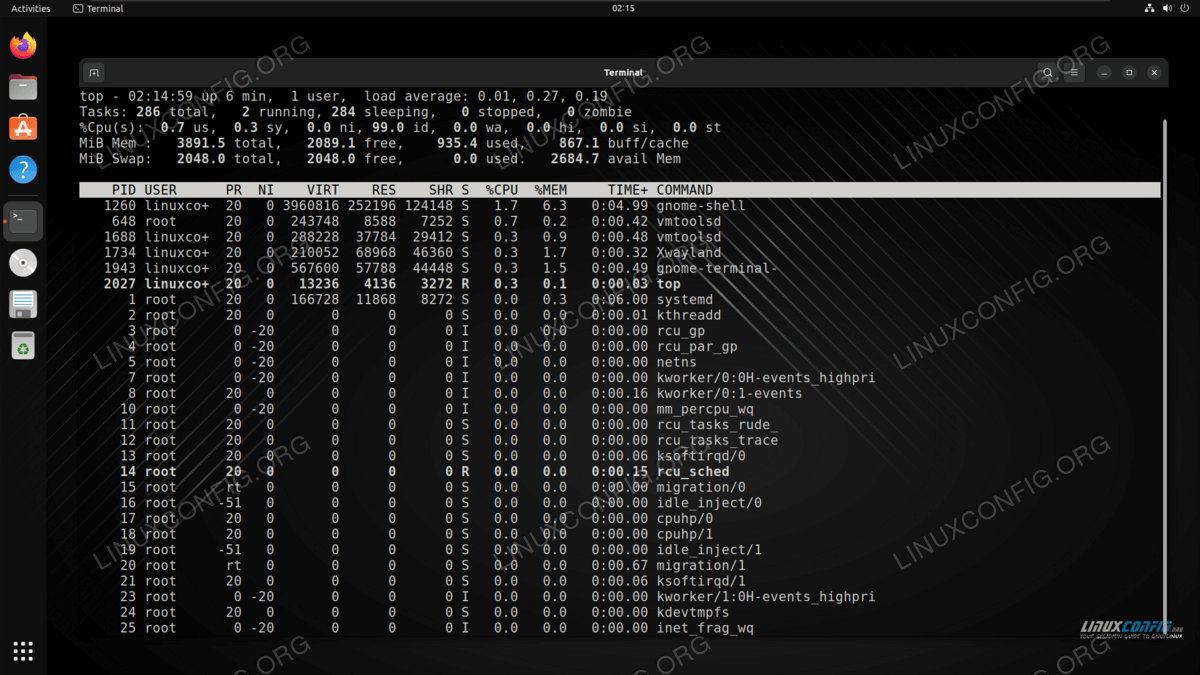
top and htop – Process Monitoring
The top command is installed by default and is a great way to see CPU and RAM usage on your system. It will also allow you to check which processes are consuming the most system resources. This will give you insight as to whether or not it may be necessary to upgrade system components, or rein in services that may be tying up an unreasonable amount of system CPU or memory.
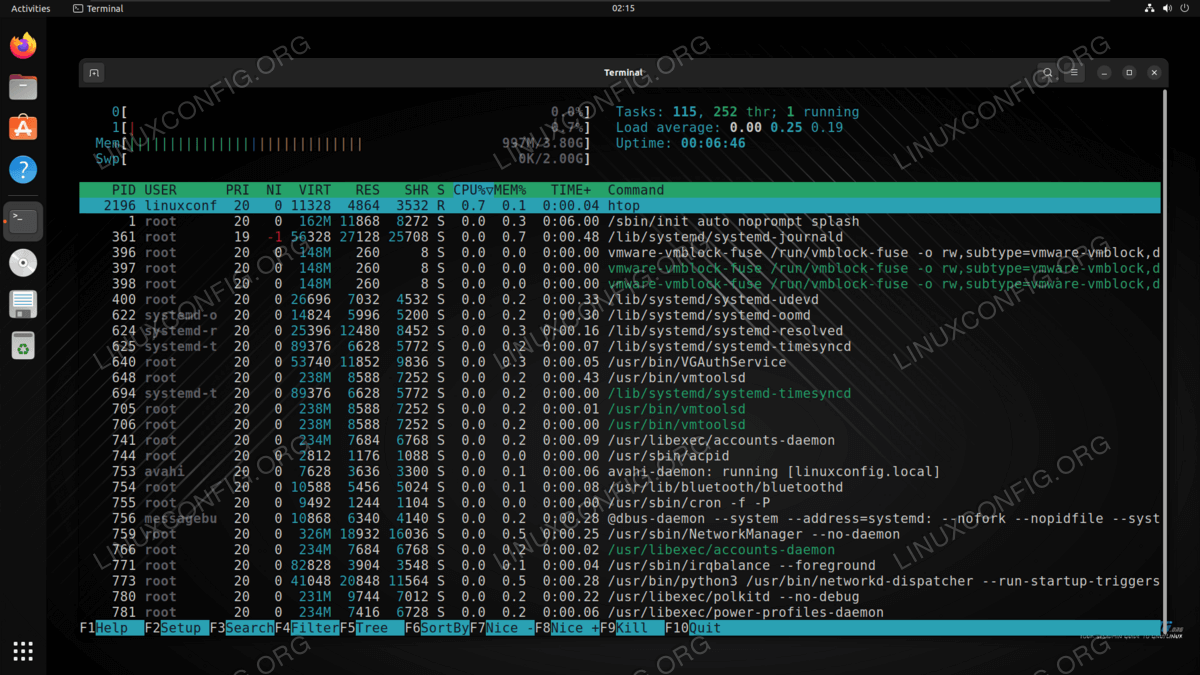
A better alternative would be the htop command, which is just like top but more human readable. It gives you a summary that is easier to digest and interact with, but the program is usually not installed by default. If possible, it is highly recommended to install this program and use it to get a quick glimpse of which processes are chewing up the majority of your system’s hardware resources.
$ sudo apt install htop # Ubuntu, Debian, Linux Mint $ sudo dnf install htop # Fedora, Red Hat, CentOS, AlmaLinux $ sudo pacman -S htop # Arch Linux, Manjaro
free – Memory Usage Statistics
The free command is installed by default and allows you to check RAM usage as well as monitor it in real time.
# free -h total used free shared buff/cache available Mem: 1.9G 784M 145M 20M 1.0G 1.0G Swap: 947M 0B 947M
The -s (seconds) switch allows free to run continuously, issuing new output every specified number of seconds. For example, to run the free command every 3 seconds:
To see more free usage examples and explanations, check out our tutorial on How to Monitor RAM Usage on Linux.
SMART Data – Check Hard Drive Health
All hard drives collect data about their performance statistics, bad sectors, power on hours, and other information. These stats are known as SMART (Self Monitoring Analysis and Reporting Technology) data, and can be viewed if your system has the smartmontools package installed.
$ sudo apt install smartmontools # Ubuntu, Debian, Linux Mint $ sudo dnf install smartmontools # Fedora, Red Hat, CentOS, AlmaLinux $ sudo pacman -S smartmontools # Arch Linux, Manjaro
To use smartmontools to check the current status of a hard drive (/dev/sda):
To see more smartctl usage examples and learn how to run diagnostic tests on your hard drives, check out our tutorial on How to check an hard drive health from the command line using smartctl.
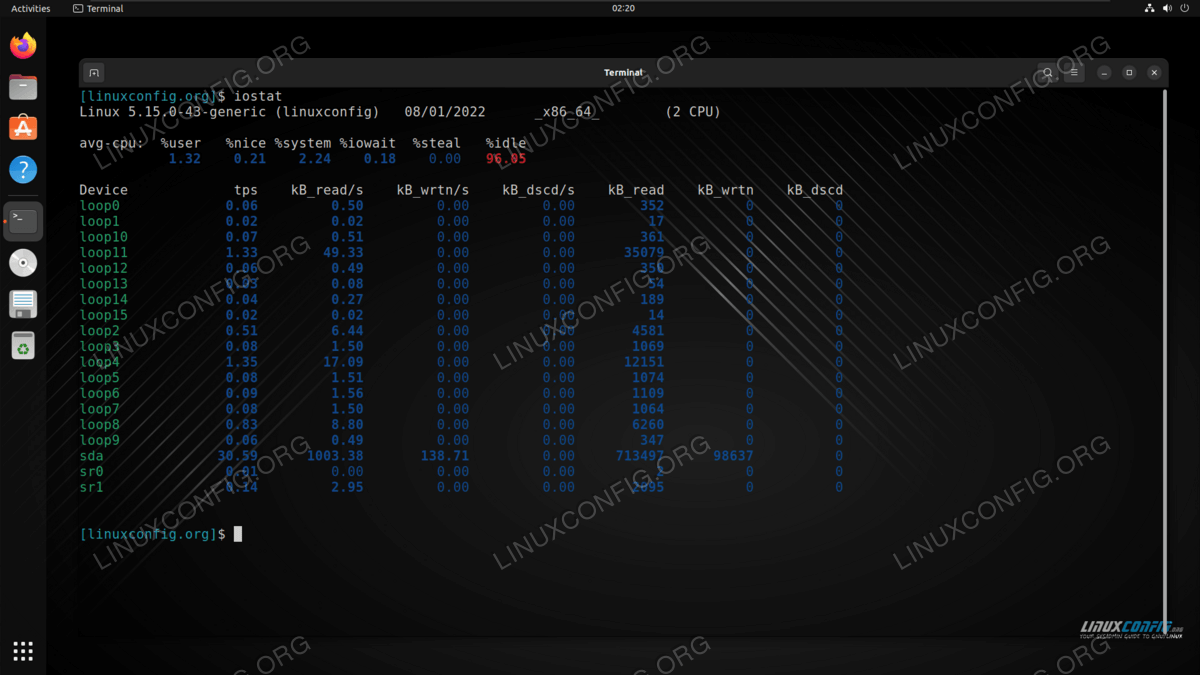
Hard Drive Input/Output Statistics
If you are working with computers that do lots of read/write operations, like a busy database server, for instance, you will need to check disk activity. This can be done with the help of the iostat command, which will give us statistics about the input and output operations of all the hard disks in our system.
iostat is available in the sysstat package. To install sysstat:
$ sudo apt install sysstat # Ubuntu, Debian, Linux Mint $ sudo dnf install sysstat # Fedora, Red Hat, CentOS, AlmaLinux $ sudo pacman -S sysstat # Arch Linux, Manjaro
Or to run continuously for 10 seconds:
Hardware Temperature Monitoring
Another basic health check to perform is monitoring your system’s temperature. Incorrectly installed heat sinks, clogged vents, or dust-ridden chassis fans can lead to high temperatures, which are a detriment to the longevity of system components, including the CPU, video card, etc. This can be accomplished through the sensors-detect command.
sensors-detect is available in the lm_sensors package. To install lm_sensors:
$ sudo apt install lm-sensors # Ubuntu, Debian, Linux Mint $ sudo dnf install lm_sensors # Fedora, Red Hat, CentOS, AlmaLinux $ sudo pacman -S lm_sensors # Arch Linux, Manjaro
$ sudo sensors-detect k8temp-pci-00c3 Adapter: PCI adapter Core0 Temp: +32.0°C Core0 Temp: +33.0°C Core1 Temp: +29.0°C Core1 Temp: +25.0°C nouveau-pci-0200 Adapter: PCI adapter temp1: +58.0°C (high = +100.0°C, crit = +120.0°C)
Network Activity Monitoring
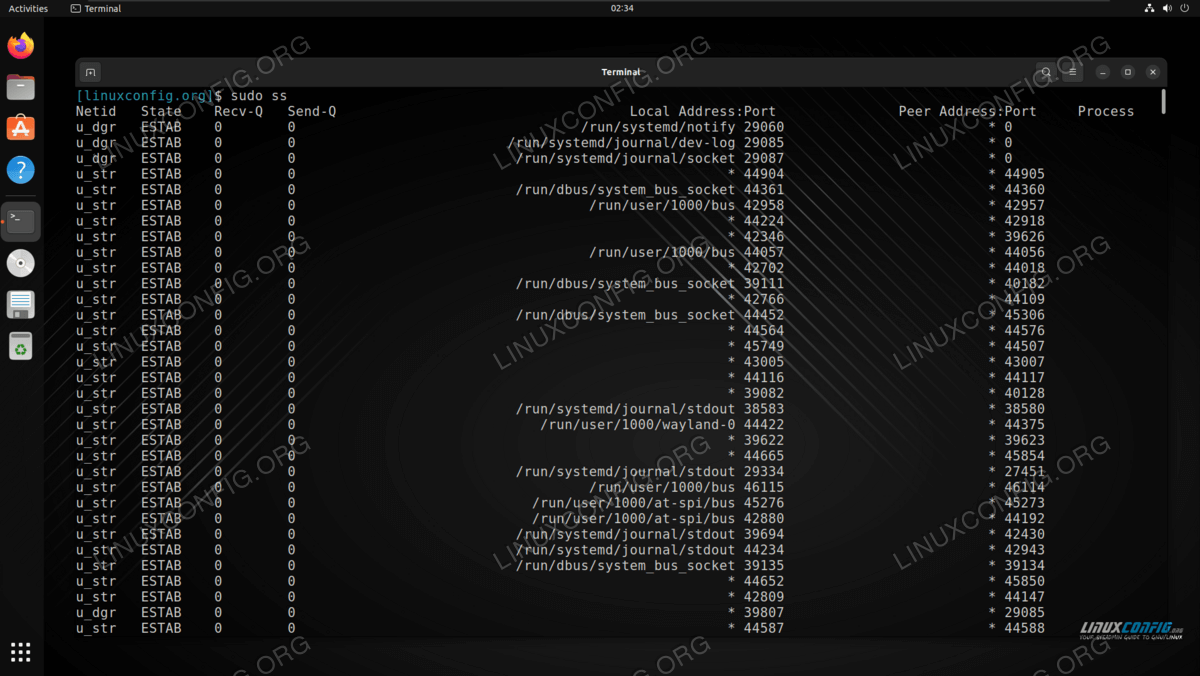
The ss command is the successor to the netstat command on Linux systems. The command is used by system administrators to see information about network connections. This means we can check the health of our network by understanding which processes and services are communicating across our local network as well as the internet.
The ss command also allows you to check things like the status, origin, and destination of connections. In addition, ss displays route tables, interface statistics, masquerade connections, and multicast memberships.
It should already be installed by default on all major Linux distros. It comes with many extra options, or you can just run the command by itself (recommended to run as root):
To see more about the ss command, including usage examples and options, check out our tutorial on Using ss command on Linux.
Closing Thoughts
In this tutorial, we saw how to use commands to perform a basic health check on a Linux system. This included commands to check system processes, hard drive diagnostic data, input and output stats, hardware temperatures, network connections, CPU usage, and RAM usage. As you can see, Linux has no shortage of tools to let us monitor our system for problems. It is necessary for all system administrators to run these and similar commands on a regular basis in order to maintain a healthy system.
Related Linux Tutorials:
Comments and Discussions