- How to Use the top Command in Linux
- top Command Syntax and Options
- top Command Examples
- List All Processes
- Send a Signal
- Exit After X Repetitions
- Sort Processes
- Filter Processes by Specific User
- Change Display Units
- Change Output Contents
- Change Text Color
- Show Process Command Line
- See Process Hierarchy
- Show Active Tasks
- Limit Process Number
- Change Process Priority
- Filter Processes
How to Use the top Command in Linux
The top (table of processes) command shows a real-time view of running processes in Linux and displays kernel-managed tasks. The command also provides a system information summary that shows resource utilization, including CPU and memory usage.
In this tutorial, you will learn to use the top command in Linux.

top Command Syntax and Options
To run the top command, type top in the command line and press Enter. The command starts in interactive command mode, showing the active processes and other system information. Customize the view using the available options.
Below is the top command syntax with all the available options and flags:
top -hv | -bcEeHiOSs1 -d secs -n max -u | U user -p pid(s) -o field -w [cols]The switch ( — ) and whitespace characters are optional.
| Option | Name | Description |
|---|---|---|
| -h | Help | Shows the command help file. |
| -v | Version | Shows the library version and usage prompt and then quits the program. |
| -b | Batch mode | Starts top in batch mode, allowing to send the command’s output to a file or other programs. top doesn’t accept input in batch mode and runs until killed or until it reaches the specified iteration limit. |
| -c | Toggle command line/program name | Reverses the last remembered c state. If top displayed command lines, that field now shows program names and vice versa. |
| -d [secs.tenths] | Delay time interval | Prompts you to specify the delay before updating the screen, overriding the default value. The value is in seconds. The command accepts fractional seconds but doesn’t accept negative numbers. |
| -e [k | m | g | t | p] | Toggle task memory scaling | Allows you to change top task area memory scaling. The available scaling options are k (kibibytes), m (mebibytes), g (gibibytes), t (tebibytes), p (pebibytes). |
| -E [k | m | g | t | p | e] | Toggle summary memory scaling | Allows you to change top summary area memory scaling. The available scaling options are k (kibibytes), m (mebibytes), g (gibibytes), t (tebibytes), p (pebibytes), e (exbibytes). |
| -H | Threads mode operation | Specifying the -H option instructs top to display individual threads instead of a sum of all threads in each process. |
| -i | Idle process toggle | Reverses the last remembered i state. When the toggle is OFF, top doesn’t display the tasks that haven’t used CPU resources since the last update. |
| -n | Limit iteration number | Specify the maximum number of iterations you want top to produce before ending. |
| -o [field name] | Overwrite sort field | Specify the field name top uses to sort tasks. Prepending a + to the field name forces top to sort high to low while prepending it with — orders tasks low to high. The -o option primarily supports automated batch mode operation. |
| -O | Output field names | The -O option complements the -o option, causing top to print each of the available field names separately and then quit. |
| -p [N1, N2. ] | Monitor process IDs mode | Instructs top to monitor only the processes with the specified process IDs. When combined with the threads mode ( -H ), top shows all the processes in each monitored PID thread group. The maximum number of PIDs is 20. Specifying the PID value 0 is considered as the top program process ID. To return to normal operation, issue any of the following commands: = , u , or U , as they are mutually exclusive. |
| -s | Secure mode operation | Starts top in secure mode, even for root. |
| -S | Cumulative time toggle | Reverses the last remembered S state. When the cumulative time toggle is ON, each process is listed with the CPU time it has used. |
| -u | -U [ID or name] | User filter mode | Displays only the processes matching the specified user ID or user name. The -u option matches only the effective user, while the -U option matches any user — real, effective, saved, or filesystem. Prepending the user ID or user name with an exclamation point ( ! ) causes top to display only the processes that don’t match the one provided. |
| -w [number] | Output width override | When used without an argument, -w instructs top to format the output using the COLUMNS= and LINES= environment variables, if applicable. Otherwise, the width is fixed at 512 columns maximum. Appending an argument to -w increases (up to 512) or decreases the output width while the row number is unlimited. The program never exceeds the actual terminal dimensions at which top was invoked. |
| -1 | Single/separate CPU states toggle | Reverses the last remembered CPU state portion. Depending on the NUMA Node command toggle ( 2 ) state, either displays all CPU information in a single line or separately. |
top Command Examples
Below are the most common top command use cases. The options are case-sensitive, which means that pressing N and n invokes a different action.
Note: Use the top command options by pressing the corresponding key while top is running or enter the option flag directly in the top command syntax and run it from the command line.
List All Processes
To list all running Linux processes on your system, open a terminal and enter:
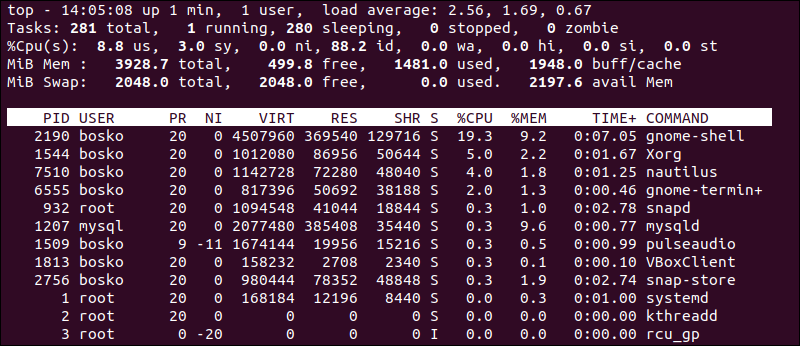
The output displays the summary area (the dashboard with resource usage stats) and the task area (a list of all processes). top updates the information every three seconds by default.
If the process list is long, scroll through it using the Up and Down arrows and Page Up and Page Down keys. To quit top , press q.
Send a Signal
Use the top command to send any signal to a running process. Press the k key and enter the process PID. top gives you a chance to type the signal you want to send. Not entering a specific signal kills the process.
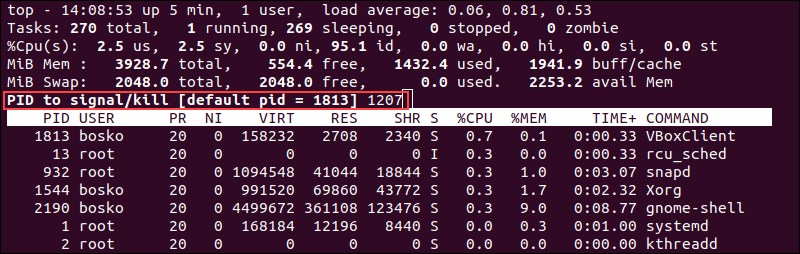
Here, we killed the mysql process 1207 .
Note: See other ways to kill a process to increase system performance. And if you need to allow processes to complete even after logging out, check out our post How to Use Linux nohup Command.
Exit After X Repetitions
The top command keeps refreshing the statistics until quitting the program by pressing q. Instruct top to quit automatically after refreshing the stats for a specified number of times.
For [X] , specify the number of times you want top to refresh the output.
Sort Processes
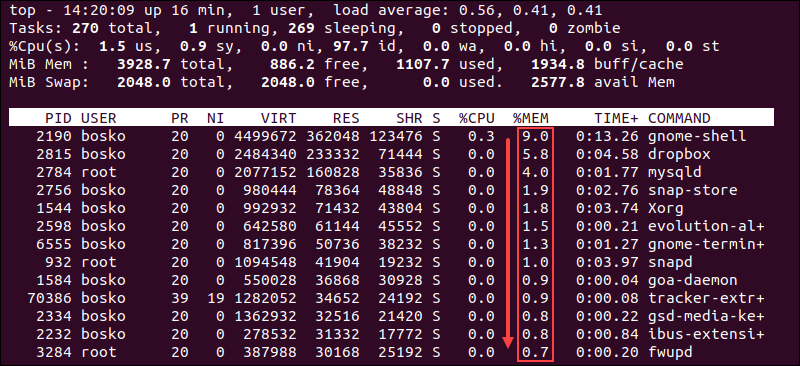
By default, top sorts the process list using the %CPU column. To sort processes using a different column, press one of the following keys:
In the following example, the process list is sorted by the %MEM column:
Note: Make the settings and customizations persistent by pressing the W key. The changes will be in effect the next time you start top . The configurations are kept in the .toprc file in your home directory.
Filter Processes by Specific User
The -u option allows you to display all user-specific processes. Press the u key while top is running or use the following syntax:
Pressing the u key in interactive mode prompts for the user name or user ID.
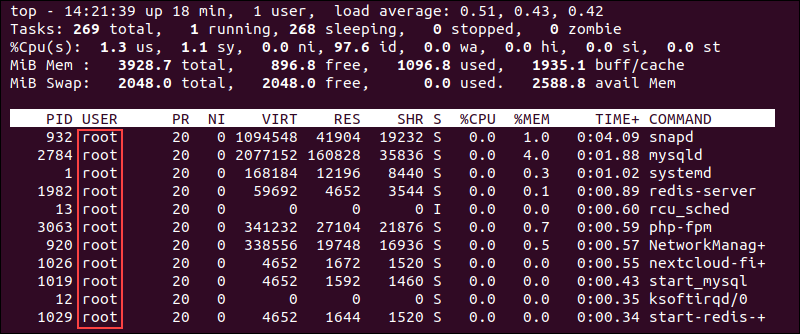
In the example above, the output shows only processes for the root user.
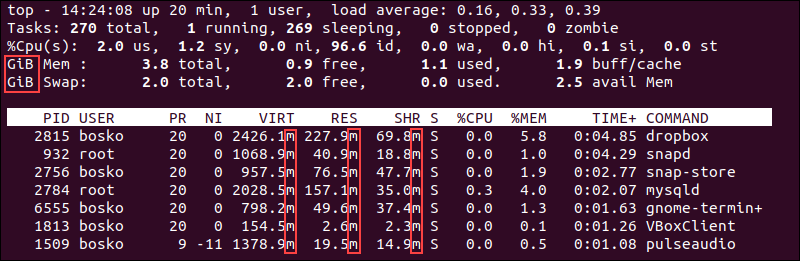
Change Display Units
Use the E key to choose the units you want top to use for displaying the memory values. Press lowercase e to choose the units for displaying values in the process list. The available options are:
- kibibytes (KiB)
- mebibytes (MiB)
- gibibytes (GiB)
- tebibytes (TiB)
- pebibytes (PiB)
- exbibytes (EiB — applies only for memory values)
The value that is currently in use is the first item on lines four and five.
In the following example, we have set the dashboard memory units to gibibytes, and the process list memory units to mebibytes:
Change Output Contents
The default top output contains a lot of information and may appear confusing. Tune the contents with a few keypresses, find the information you need, or delete certain sections from the summary.
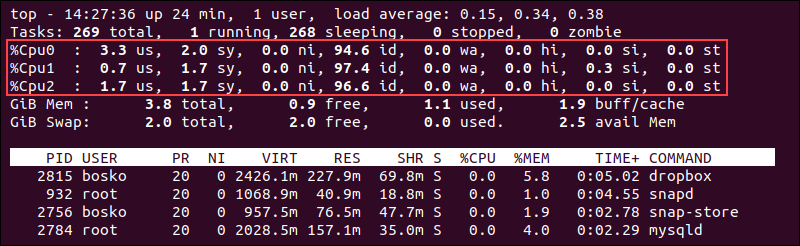
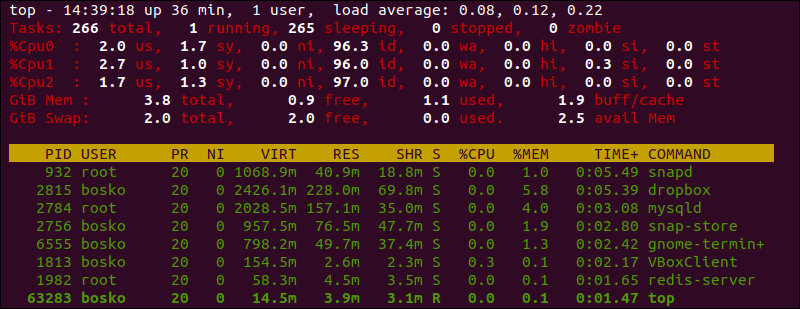
Individual CPU Core Statistics
Pressing 1 on your keyboard allows you to see individual statistics for each CPU core. Press 1 repeatedly to toggle core statistics.
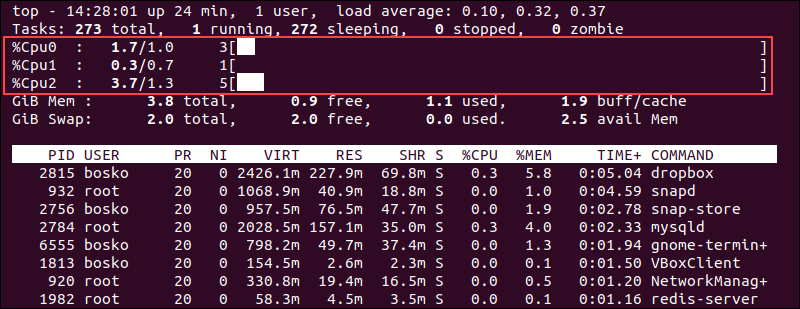
CPU Usage Graph
If you want a graphical representation of CPU usage, top supports elementary ASCII graphs, denoting each CPU core usage. Toggle the graphs on or off by pressing t.
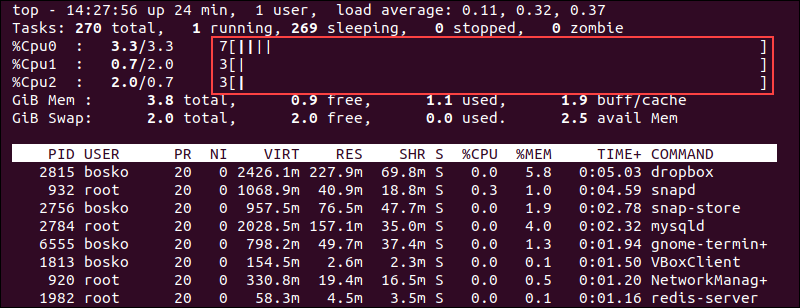
To change the graph display to solid block characters, press t again.
Press t again to remove the CPU display and task summary section.
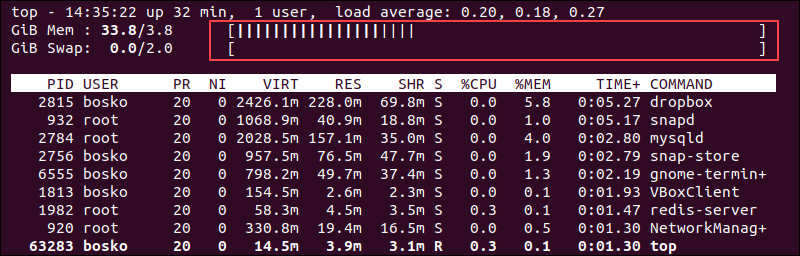
Memory Usage Graph
The command also supports graphical display options of memory and swap memory lines. To get a visual representation of memory usage, press m. Remove the lines by pressing m again.
Change Text Color
Emphasize the information in the output by adding color to the output. Press the z key to add color to the display:
By default, the color changes to red. To further customize display elements and choose a different color, follow the steps below:
1. Open the color settings page by pressing Z.
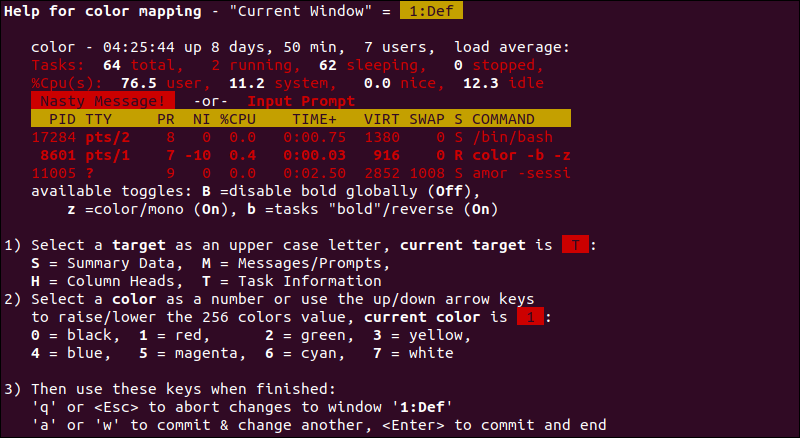
2. Choose which display element you want to change by pressing:
- S. Summary Data area.
- M. Messages and prompts.
- H. Column headings.
- T. Task information in the process list.
Press Enter to confirm your choice.
3. Pick the color for the selected element with one of the following keys:
Confirm your choice with Enter.
Now test the new settings:
We instructed top to print the process list in green, as you see in the example above.
Show Process Command Line
To see the full command line instead of the process name, press the c key. To toggle back to displaying the process name, press c again.
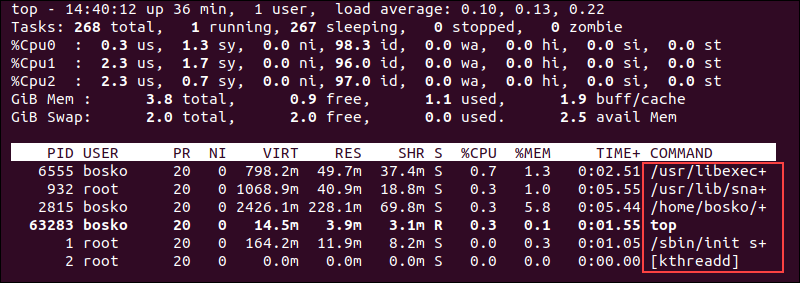
See Process Hierarchy
To see which processes were launched or spawned by other processes, press the V key.
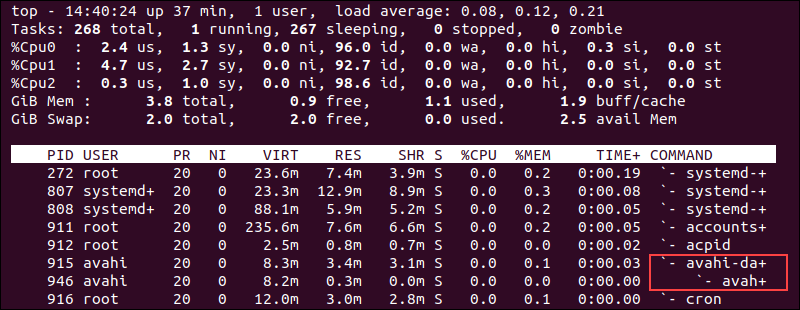
The tree view is useful when you want to see the child-parent process hierarchy on your system.
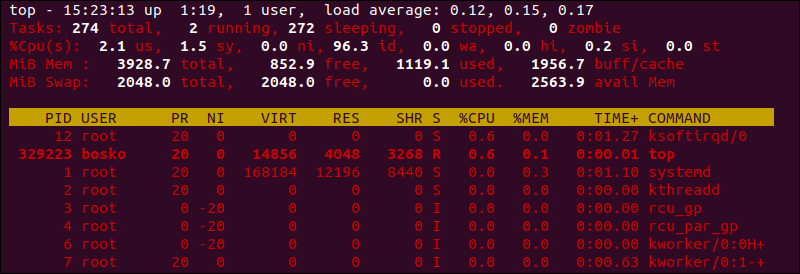
Show Active Tasks
To filter the output and show only active tasks, press the I key.
The output hides the tasks that haven’t used any CPU resources since the last update.
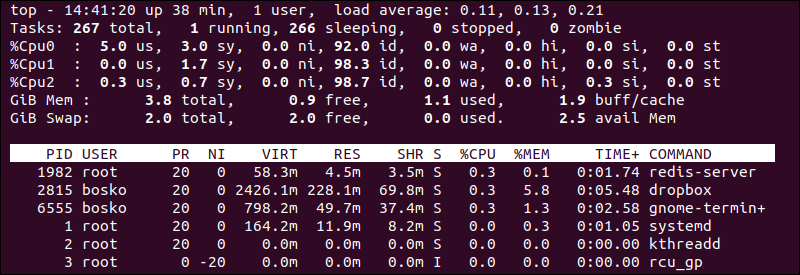
Limit Process Number
Press the n key to limit the process number in the output. Regardless of the number of active processes. top prompts you to enter the number of processes you want to see.
For example, we want to show only the top 5 processes:
Change Process Priority
The top command allows changing the process priority (nice value).
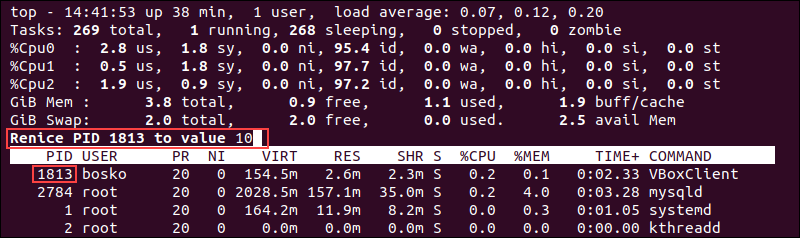
1. Run top and press the r key.
2. When prompted, enter the process ID and press Enter.
3. After you enter the PID, the program prompts for a new nice value. Enter a new value and press Enter.
Note: Negative nice values indicate a higher process priority.
For example, we have set a nice value of 10 to a VBoxClient process instance:
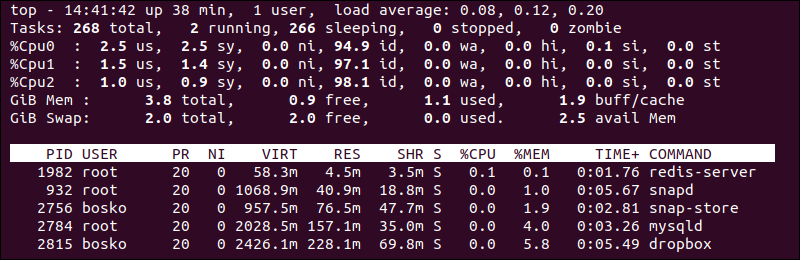
Filter Processes
The top filter feature allows using a filter expression to limit which processes to see in the list. Activate the filter option by pressing the o key. The program prompts you to enter a filter expression.
For example, we entered the following filter:
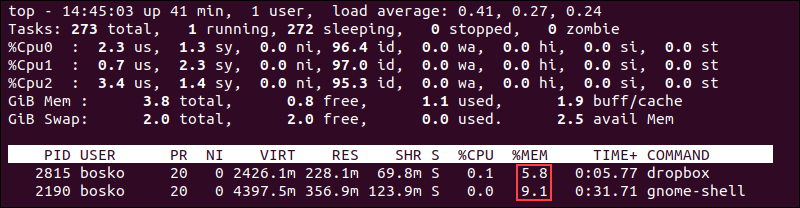
The top command now shows only the processes that used more than 5% memory. Clear the filters by pressing = .
The top command is a must when trying to identify a problem and deal with it before it affects your system. The dashboard provides an abundance of system information and metrics that help you control running processes, while the various options allow you to find and resolve any possible issues quickly.
For a comprehensive list of other useful Linux commands, download our Linux commands cheat sheet.