- Linux Top Command Explained
- Prerequisites
- Top Command in Linux
- Functioning of the Top Command
- Linux Top Command Syntax
- The Default Window of Linux Top Command
- Top Command Examples
- Display all Active Processes
- Browsing Through the Output
- Changing the Display Color
- Updating the Display Units
- Showing or Hiding Information
- Displaying Processes for the Specific User
- Listing only Active Tasks
- Killing a Process
- Sorting Processes by Memory and CPU Usage
- Displaying Complete Commands
- Choosing the Number of Processes to display
- Top Command Options
- Conclusion
Linux Top Command Explained

Every Linux process requires several resources to complete its operations. System administrators must always monitor these running processes and consumed resources to optimize system performance. The top or table or processes command-line utility in Linux shows a real-time process list of the kernel-managed tasks and processor activities.
In this tutorial, we will learn how to use the top command in Linux and what output it displays.
Prerequisites
- A computer with multiple running processes.
- Terminal window access and familiarity with command-line interface.
- Sudo or normal user privileges to execute the commands and try these examples.
Top Command in Linux
Top is a task management tool in Linux. The Linux top command-line utility displays a table of processes on your computer and also displays a dynamic real-time status of the tasks managed by the Kernel. The top command prints information about CPU and memory usage of all the running processes.
The top command comes installed by default on your Linux computer, and the default display provides a list of useful information on your terminal window. You can even display information in color, create elementary graphs, and highlight running tasks.
Functioning of the Top Command
The default output of the top command shows standard CPU metrics along with the list of all the processes in a dashboard-like format. The upper part contains five lines and every line contains some metrics.
The very first line displays short running system information, such as load average, uptime, and the number of currently logged-in users. The second line displays a list of tasks, and the third line shows CPU load. Memory usage is displayed in the next two lines.
The lower part of the output screen presents a real-time show of all currently running processes. You can use commands or keyboard shortcuts to shuffle through this information to find what you are looking for.
Linux Top Command Syntax
The syntax of the top command in Linux with full command-line options is as follows:
top -hv | -bcEeHiOSs1 -d secs -n max -u | U user -p pid(s) -o field -w [cols]The Default Window of Linux Top Command
The default top command in Linux output is when you use this command without any option:
The default output shows a summary of the system resources and their usage in the dashboard area and dynamic list of Linux processes in the task area. The running process list and summary keep updating automatically and by default, the screen refreshes every three seconds. Press the q key to return to the user prompt.
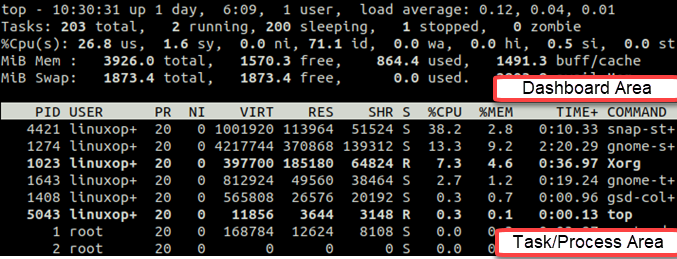
The first row on your screen show system time, system running time, number of logged-in users, and system load average in the last one, five, and 15 minutes. The next line displays total, running, sleeping, stopped, and zombie Linux processes.
The third row represents CPU usage information. Each value represents the time CPU spends executing Linux processes:
- us: time spent on the running processes for the users.
- sy: time spent on the running processes for the kernel.
- ni: time spent on the running processes with a user-configured nice value.
- id: idle time.
- wa: time spent waiting for the I/O Linux processes to complete.
- hi: time spent on servicing the hardware interrupts.
- si: time spent on servicing the software interrupts.
- st: time lost for running virtual machines. This value is also known as the steal time.
The fourth and fifth entries show physical memory (RAM) and swap memory lines in kibibytes (KiB).
The process area columns represent the following values:
- PID is the Linux process ID.
- USER is the Linux process owner.
- PR represents Linux process priority. The process priority is assigned automatically.
- NI is the Linux process nice value.
- VIRT is the virtual memory consumed by the running process.
- RES is the resident memory consumed by the running process.
- SHR is the shared memory consumed by the running process.
- S represents the process status, which can be running, sleeping, traced, uninterruptable sleep, or zombie.
- %CPU is the percentage of CPU usage by the process.
- %MEM is the percentage of the memory used by the process.
- TIME+ is the total CPU usage time for the process. This CPU time is displayed in the hundredths of a second.
- COMMAND is the name of the command.
Use the additional command options to change the default display and represent the process list in the desired format.
Top Command Examples
The top command output contains lots of information and you may not need all the system statistics for the tasks that you are performing. It opens in the interactive command mode and you can use keyboard keys to modify the results. Here, we will show you how to use the top command for different use cases with practical examples.
Display all Active Processes
To display all the active system processes, use the top command without any options. The output will show as many Linux processes as it can fit on your screen. You can scroll to see the rest of the processes and keep track of PIDs to monitor a process:
Browsing Through the Output
The default top command output displays as much system information as possible and you have to navigate through the results to check all the statistics if the number of processes is high.
To scroll through the results, use the Up and Down arrows and Page Down and Page Up keys. If the results do not fit on the screen horizontally, then you can use the Left and Right arrow keys. As you scroll through the results, you will notice that some values like CPU statistics are changing based on your selection. For example, using the Page Down key shows you the last process entry in the results:
Changing the Display Color
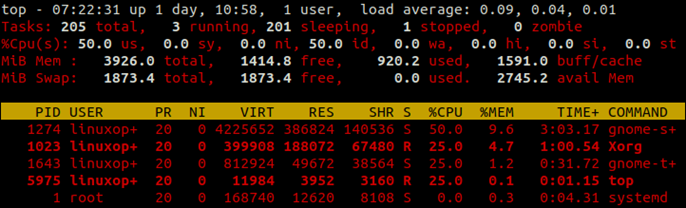
Press the z (lowercase) key to color and highlight the tasks and processes in the top command output. The default color output looks as follows:
You can further customize the display options using the following steps:
1. Press Z (uppercase) key to open color display settings:
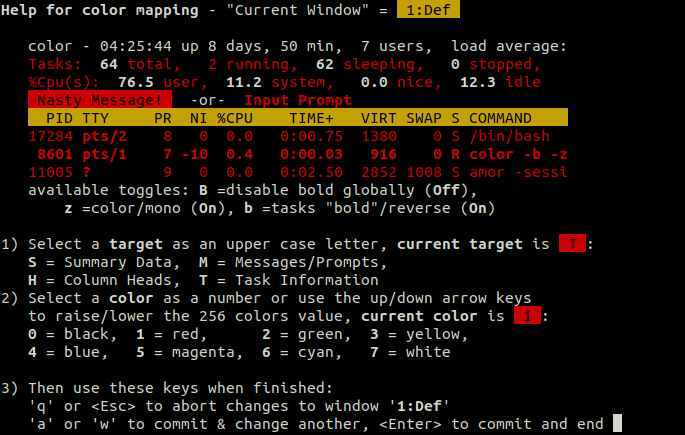
2. Choose a target area, as shown in the following example, to modify the color. Your selection is displayed as the current target.

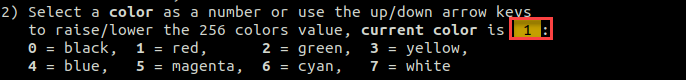
3. Choose the color of your choice, as shown in the following example, for the selected target area. Your selection is displayed as the current color:
4. Press Enter key to apply the changes or the Esc key to ignore the changes.
To change the task information color to green, press T, 2, and Enter keys sequentially in the color settings.

Updating the Display Units
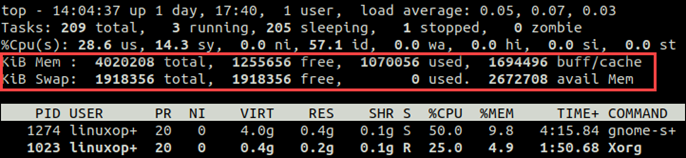
Press the E (uppercase) key to switch display memory values among kibibyte (KiB), mebibyte (MiB), gibibyte (GiB), and tebibyte (TiB) in the task/dashboard area. For example, the default display of the top command shows memory units in KiB:
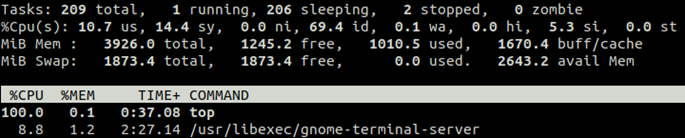
Press the E key once to change display units to MiB:

Press the lowercase e key to switch process list memory units among kibibyte (KiB), mebibyte (MiB), gibibyte (GiB), and tebibyte (TiB) in the process area:

Showing or Hiding Information
You can choose to display or hide some of the content from the top command output. Some of the options that you can use are:
Press l (lowercase) from the keyboard to show or hide the system time, number of logged-in users, and load average information:

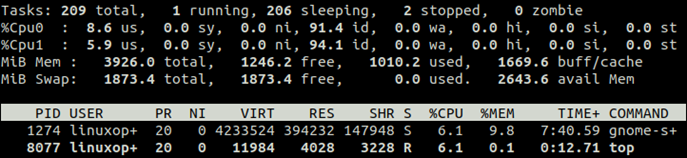
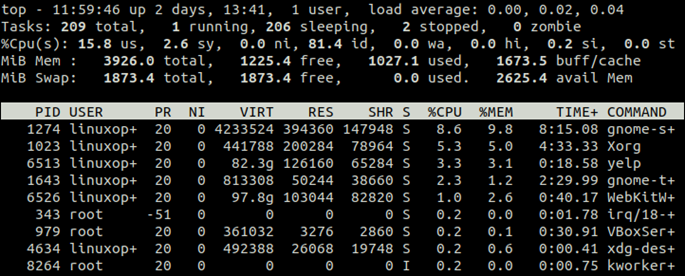
Press 1 from the keyboard to display individual statistics for the CPUs if you have more than one CPU. We have 2 CPUs in our computer and the following example displays information for both the CPUs:
Press t (lowercase) from the keyboard to switch CPU display from numbers to a graph to solid block characters:


Press t (lowercase) once more to completely remove the CPU statistics:

Similarly, you can change the memory usage display units by pressing the m key.
Displaying Processes for the Specific User
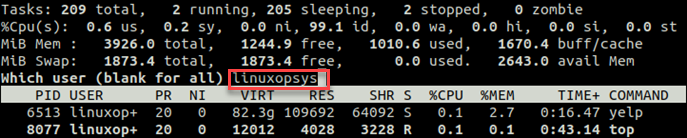
Press u (lowercase) key and then enter the username to display only processes for the specific user:
Listing only Active Tasks
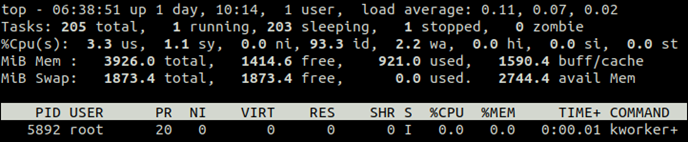
Press the i (lowercase) key from the keyboard to display the active tasks:
Killing a Process
Press the k (lowercase) key and specify the process ID (PID) to kill a particular process and press the Enter key twice to confirm the kill operation:
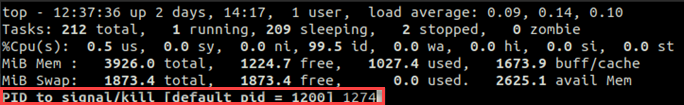
By default, the first process in the list killed, if you do not specify a process ID (PID).
Sorting Processes by Memory and CPU Usage
By default, the top command results are sorted by %CPU column. Press the following keys to change the sorting order:
- N to sort processes by the PID column.
- M to sort processes by the %MEM column.
- T to sort Linux processes by the TIME+ column.
- P to sort Linus processes by the %CPU column.
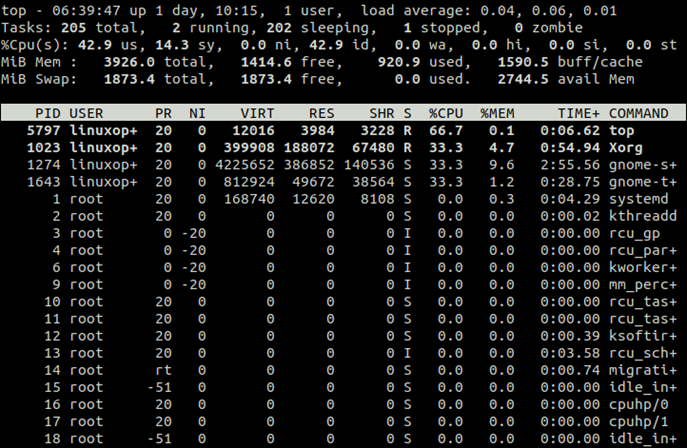
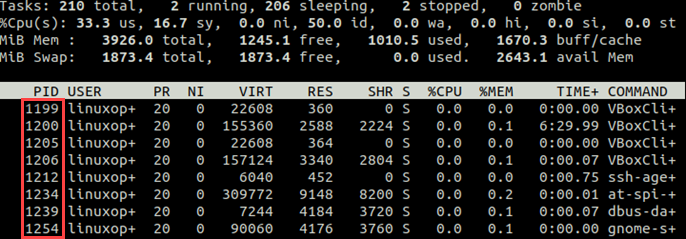
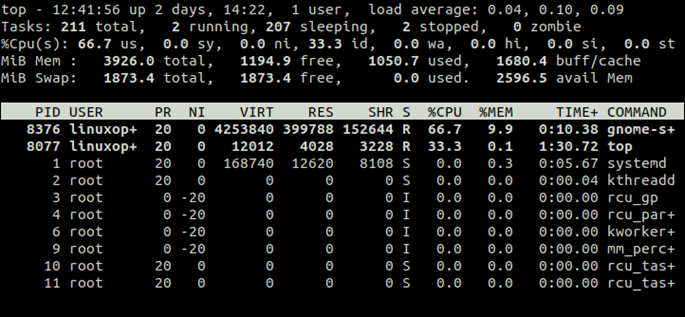
The following example shows results sorted by the PID column:
Displaying Complete Commands
Press the c key to show or hide the complete command:
Choosing the Number of Processes to display
Press the n key to specify the number of processes to display on the screen:
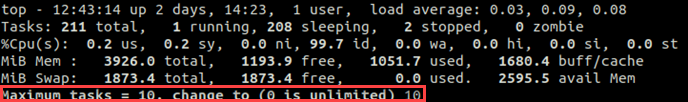
We specified 10, so only 10 processes are displayed:
Top Command Options
The following table describes the top command options that will help you customize the output:
| Options | Description |
|---|---|
| -h | Displays command help. |
| -v | Displays version information. |
| -b | Runs the command in batch mode. |
| -c | Shows the last remembered state. |
| -d | Updates screen refresh delay. |
| -e | Updates task area memory scaling. |
| -E | Updates summary area memory scaling. |
| -H | Displays individual threads. |
| -i | Displays idle and active processes. |
| -n | Limits the number of results. |
| -s | Works in a secure mode. |
| -S | Displays processes with CPU times. |
| -u | Shows processes for the specified user. |
| -1 | Displays information for multiple CPUs. |
Conclusion
In this tutorial, we learned about the top command in Linux. This is one of the most commonly used Linux commands used by Linux system administrators to monitor system resources and processes. The top command offers various options that you can use to format your results.
If this resource helped you, let us know your care by a Thanks Tweet. Tweet a thanks