Top 5 Linux Monitoring Tools. Web Based.
Linux system monitoring is one of the most important tasks for every sysadmin: it is crucial to know everything about system including CPU load, network traffic statistics, memory consumption, logged in users, availability of disk free space or service. And it’s inevitable that something breaks or goes down from time to time so usually it’s just better to know it happened from Linux monitoring system’s alert rather than from angry user. Believe me, it is true.
In this article I’ve listed top 5 web based Linux monitoring tools which can cover almost all aspects of sysadmin’s monitoring tasks.
Nagios
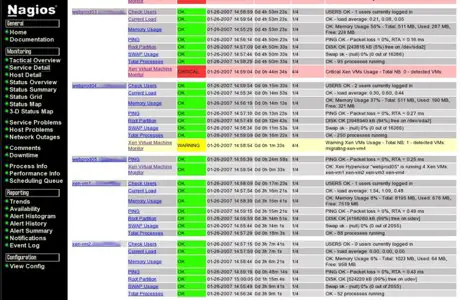
This is one of the most popular web based Linux monitoring systems nowadays, actually it’s industry standard for IT infrastructure monitoring. Licensed under GPL Nagios is available for everybody free of charge and allows to monitor availability and response time of network services, usage of system resources like CPU load, RAM allocation etc., number of logged in users and many-many more. It doesn’t makes sense to list here everything that can be monitored by Nagios but its nature implies that main Nagios instance (server) collects information from either local system or Nagios clients (agents). It means you can install client software on number of Linux, BSD, Windows hosts or Cisco devices, point them to Nagios server and see states of their services or processes in one place: Nagios web based monitoring tool (see the screenshot below).
In case of any outage detected by Nagios server or any anomaly you will get an alert from Nagios. It’s important that Nagios suports wide range of alerts including e-mail, sms, chat messages and phone call notifications. Large number of official and third party plugins can extend Nagios’ functionality dramatically.
And one more thing, Nagios monitors states but it doesn’t show any graphs like network interface usage etc., that’s why it’s good habit to use Nagios with other monitoring tools listed below.
Project’s homepage: http://www.nagios.org/
Documentation and Howtos: Official Documentation, How To Monitor Remote Linux Host using Nagios 3.0, Centos Nagios Howto, Ubuntu Nagios Howto, FreeBSD Nagios Howto.
Cacti
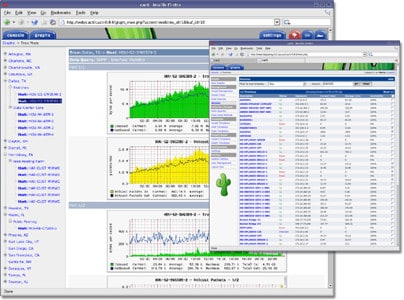
Cacti is another web based monitoring system written in PHP and licensed under GPL. Unlike Nagios describe above Cacti was designed mainly fo the graphs — in brief, Cacti polls various services and then graphs resulting data. It uses RRDTool to build graphs so if you can some graphs in .rrd files you can easily attach them to Cacti and have everything in one place.
So you can see CPU load graphs, RAM usage, round trip time stats, bandwidth utilization and much more information collected from various hosts. As well as Nagios Cacti supports SNMP that makes it possible to monitor almost any device in your network: Linux hosts, *BSD hosts, Windows hosts, Cisco devices, Juniper equipment, voip phones, routers, switches whatever.
Meantime by default Cacti doesn’t provides alerts so you should install third party plugin (thold or others) for that or use more flexible solutions supporting alerts (like Nagios or Zabbix).
Project’s homepage: http://www.cacti.net/
Documentation and Howtos: Official Documentation, Centos/RedHat Cacti Howto, Debian SNMP+Cacti Howto, Ubuntu Cacti Howto.
Zabbix
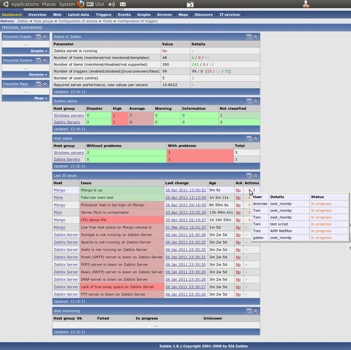
Zabbix is enterprise class Linux monitoring system with impressive list of capabilities available out of the box. It is licensed under GPL and is written in PHP. In brief Zabbix can do the same tasks as Nagios and Cacti by default: Zabbix easily graphs monitored data and sends alerts to user in case of any problem. Using Zabbix you can create maps of the hosts, group hosts by various categories and so on.
I personally like Zabbix’s capability to track changes made into specified files, for example if /etc/password is changed at one of your 100 servers and you monitor it with Zabbix then you’ll get corresponding report about this authorized (or not!?) change.
Zabbix can collect data from remote hosts where Zabbix agent/client is running (just like Nagios). Zabbix shows various kinds of graphs including network statistics, CPU load and so on (just like Cacti). Probably Zabbix may seem rather complicated for beginners but I’d recommend to take some time and get familiar with this monitoring system.
Project’s homepage: http://www.zabbix.com/
Documentation and Howtos: Official Documentation, Ubuntu Zabbix Howto, Debian Zabbix Howto, Monitor Radius with Zabbix.
MRTG
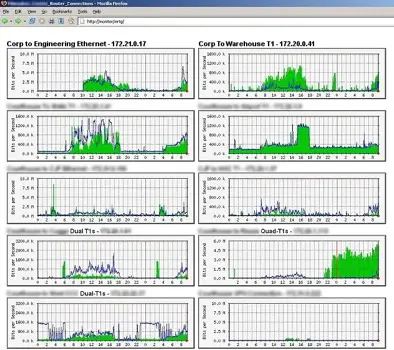
MRTG is yet another open source monitoring tool that collects data at local and/or remote host by means of SNMP protocol. But MRTG is much more simple than Cacti, Nagios or Zabbix so it may be a good choice for small projects.
One of the most common applications of MRTG is monitoring of network interfaces, CPU, memory usage and network interfaces statistics. One of MRTG’s advantages is that it it extremely easy to deploy. Btw, MRTG was created by author of RRDTool Obi Oetiker.
Project’s homepage: http://oss.oetiker.ch/mrtg/
Documentation and Howtos: Official Documentation, Linux MRTG Howto, Advanced MRTG for Linux, Centos MRTG Howto.
Nfsen
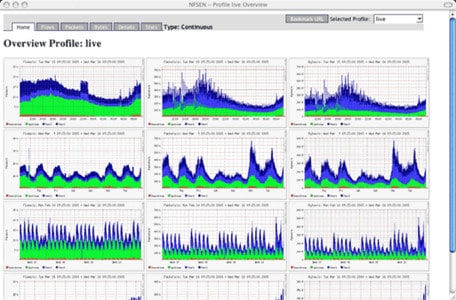
Nfsen is open source Netflow collector and analyzer available under open source license. It differs from monitoring tools described here — Nfsen collects only network usage data and shows the interactive graphs based on that data.
I found Nfsen as the only workable open source Netwflow analyzer available for Linux. Using Nfsen you can see the graphs showing network traffic on various hosts or networks, configure alerts (for example if bandwidth usage is lower or higher than average) and what it more important to digg into collected traffic.
Let’s imagine you see traffic spike at the graph that shows that some of your host was generating some TCP traffic 12 hours ago and you wish to know what was that. Nfsen makes it possible to investigate that spike and report what was destination and source IP addresses of that traffic, what was the protocol, port numbers and how many sesstions/flows were established. None of above mentioned monitoring systems do such an investigation. Nfsen’s graphs are interactive so you can select what data you wish to see at the graph and aggregate many data sources into one graph, it’s better to understand when building protocol breakdown graphs with Nfsen.
Project’s homepage: http://nfsen.sourceforge.net/
Documentation and Howtos: Official Documentation, Nfsen and Nfdump Howto, Tracking incidents with Nfsen, Traffic Classification with Nfsen.
Bottom Line
Of course there are other web based monitoring tools for Linux available, some of them may even beat functionality of mentioned systems. If you feel that it makes sense to extend this list with other monitoring system just leave a comment here with brief description of suggested Linux monitoring system. Thank you in advance.
