What Process is using all of my disk IO [closed]
Closed. This question does not meet Stack Overflow guidelines. It is not currently accepting answers.
This question does not appear to be about a specific programming problem, a software algorithm, or software tools primarily used by programmers. If you believe the question would be on-topic on another Stack Exchange site, you can leave a comment to explain where the question may be able to be answered.
If I use «top» I can see what CPU is busy and what process is using all of my CPU. If I use «iostat -x» I can see what drive is busy. But how do I see what process is using all of the drive’s throughput?
Well, technically that is true for Linux too, since user processes only modify pages in the page cache. 😉
Just the question I had and the answer I was looking for but doesn’t this kind of question fit better at SuperUser?
And this is why Linux is inferior to Solaris and MacOS because they have dtrace built in that makes this trivially simple to find out :-/
7 Answers 7
You’re looking for iotop (assuming you’ve got kernel >2.6.20 and Python 2.5). Failing that, you’re looking into hooking into the filesystem. I recommend the former.
iotop seems to be showing I/O bandwidth rather than the number of IOPS consumed by processes. This is not super relevant. A process doing lots of small writes+sync is going to consume more of the disk’s IO capacity than a process writing a large contiguous batch of data at high speed.
For small writes all I saw was [jdb2/nvme0n1p1] in iotop, but I got lucky with enabling /proc/sys/vm/block_dump and comparing the output to a healthy/stable system lxadm.com/Simple_filesystem_read/write_tracing_with_/proc/sys/… It helped find a docker container that was continuously spawning kubectl requests, exhausting an EBS volume’s burst credits with entries in /home/spinnaker/.kube/cache/discovery/. /serverresources.json . Once you narrow things down to a user/process name something like iotop -atku systemd-network | grep kubectl may also help
To find out which processes in state ‘D’ (waiting for disk response) are currently running:
while true; do date; ps aux | awk »; sleep 1; done
Wed Aug 29 13:00:46 CLT 2012 root 321 0.0 0.0 0 0 ? D May28 4:25 \_ [jbd2/dm-0-8] Wed Aug 29 13:00:47 CLT 2012 Wed Aug 29 13:00:48 CLT 2012 Wed Aug 29 13:00:49 CLT 2012 Wed Aug 29 13:00:50 CLT 2012 root 321 0.0 0.0 0 0 ? D May28 4:25 \_ [jbd2/dm-0-8] Wed Aug 29 13:00:51 CLT 2012 Wed Aug 29 13:00:52 CLT 2012 Wed Aug 29 13:00:53 CLT 2012 Wed Aug 29 13:00:55 CLT 2012 Wed Aug 29 13:00:56 CLT 2012 root 321 0.0 0.0 0 0 ? D May28 4:25 \_ [jbd2/dm-0-8] Wed Aug 29 13:00:57 CLT 2012 root 302 0.0 0.0 0 0 ? D May28 3:07 \_ [kdmflush] root 321 0.0 0.0 0 0 ? D May28 4:25 \_ [jbd2/dm-0-8] Wed Aug 29 13:00:58 CLT 2012 root 302 0.0 0.0 0 0 ? D May28 3:07 \_ [kdmflush] root 321 0.0 0.0 0 0 ? D May28 4:25 \_ [jbd2/dm-0-8] Wed Aug 29 13:00:59 CLT 2012 root 302 0.0 0.0 0 0 ? D May28 3:07 \_ [kdmflush] root 321 0.0 0.0 0 0 ? D May28 4:25 \_ [jbd2/dm-0-8] Wed Aug 29 13:01:00 CLT 2012 root 302 0.0 0.0 0 0 ? D May28 3:07 \_ [kdmflush] root 321 0.0 0.0 0 0 ? D May28 4:25 \_ [jbd2/dm-0-8] Wed Aug 29 13:01:01 CLT 2012 root 302 0.0 0.0 0 0 ? D May28 3:07 \_ [kdmflush] root 321 0.0 0.0 0 0 ? D May28 4:25 \_ [jbd2/dm-0-8] Wed Aug 29 13:01:02 CLT 2012 Wed Aug 29 13:01:03 CLT 2012 root 321 0.0 0.0 0 0 ? D May28 4:25 \_ [jbd2/dm-0-8] As you can see from the result, the jdb2/dm-0-8 (ext4 journal process), and kdmflush are constantly block your Linux.
For more details this URL could be helpful: Linux Wait-IO Problem
Being AWK pedantic, I’d rather like awk ‘$8==»D»‘; . AWK statements are condition < action >. No need for if if test is put outside of actions, in condition part. And print $0 is implicit if no other action is specified.
atop also works well and installs easily even on older CentOS 5.x systems which can’t run iotop. Hit d to show disk details, ? for help.
ATOP - mybox 2014/09/08 15:26:00 ------ 10s elapsed PRC | sys 0.33s | user 1.08s | | #proc 161 | #zombie 0 | clones 31 | | #exit 16 | CPU | sys 4% | user 11% | irq 0% | idle 306% | wait 79% | | steal 1% | guest 0% | cpu | sys 2% | user 8% | irq 0% | idle 11% | cpu000 w 78% | | steal 0% | guest 0% | cpu | sys 1% | user 1% | irq 0% | idle 98% | cpu001 w 0% | | steal 0% | guest 0% | cpu | sys 1% | user 1% | irq 0% | idle 99% | cpu003 w 0% | | steal 0% | guest 0% | cpu | sys 0% | user 1% | irq 0% | idle 99% | cpu002 w 0% | | steal 0% | guest 0% | CPL | avg1 2.09 | avg5 2.09 | avg15 2.09 | | csw 54184 | intr 33581 | | numcpu 4 | MEM | tot 8.0G | free 81.9M | cache 2.9G | dirty 0.8M | buff 174.7M | slab 305.0M | | | SWP | tot 2.0G | free 2.0G | | | | | vmcom 8.4G | vmlim 6.0G | LVM | Group00-root | busy 85% | read 0 | write 30658 | KiB/w 4 | MBr/s 0.00 | MBw/s 11.98 | avio 0.28 ms | DSK | xvdb | busy 85% | read 0 | write 23706 | KiB/w 5 | MBr/s 0.00 | MBw/s 11.97 | avio 0.36 ms | NET | transport | tcpi 2705 | tcpo 2008 | udpi 36 | udpo 43 | tcpao 14 | tcppo 45 | tcprs 1 | NET | network | ipi 2788 | ipo 2072 | ipfrw 0 | deliv 2768 | | icmpi 7 | icmpo 20 | NET | eth0 ---- | pcki 2344 | pcko 1623 | si 1455 Kbps | so 781 Kbps | erri 0 | erro 0 | drpo 0 | NET | lo ---- | pcki 423 | pcko 423 | si 88 Kbps | so 88 Kbps | erri 0 | erro 0 | drpo 0 | NET | eth1 ---- | pcki 22 | pcko 26 | si 3 Kbps | so 5 Kbps | erri 0 | erro 0 | drpo 0 | PID RDDSK WRDSK WCANCL DSK CMD 1/1 9862 0K 53124K 0K 98% java 358 0K 636K 0K 1% jbd2/dm-0-8 13893 0K 192K 72K 0% java 1699 0K 60K 0K 0% syslogd 4668 0K 24K 0K 0% zabbix_agentd This clearly shows java pid 9862 is the culprit.
How to find out which process is causing high disk usage in Linux
Excessive load on the disk can be caused by such a reason as a virus infection or incorrect program settings. In any case, you need to start by identifying the process (program) that most reads and writes to disk.
iotop – analog of top for tracking disk load in real time
The top program allows you to see which processes are consuming the most CPU time and RAM, but does not say anything about disk usage, reads and writes to disk.
The iotop program shows the speed of reading and writing to the disk, as well as the percentage of paging file used by each process.
To install iotop on Debian, Linux Mint, Kali Linux, Ubuntu and their derivatives, run the command:
To install iotop on Arch Linux, BlackArch, Manjaro and their derivatives, run the command:
The program requires elevated privileges to run:
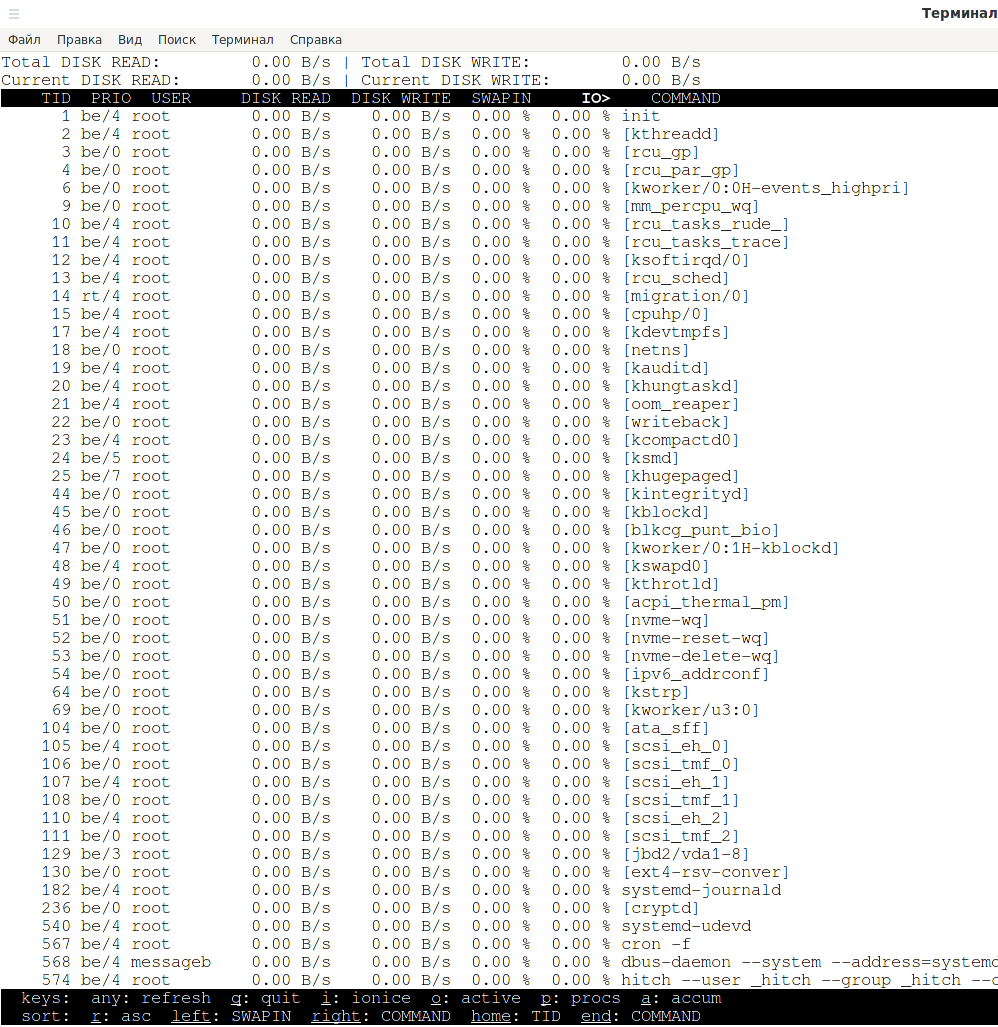
The program output contains the following columns:
- TID – process identifier
- PRIO – process priority
- USER – the user who owns the process
- DISK READ – disk read speed
- DISK WRITE – disk write speed
- SWAPIN – the percentage of swap file used
- IO> – percentage of all I/O operations
- COMMAND – the command that started the process
Using the cursor right (→) and left (←) keys, you can switch between columns, simultaneously choosing which of them will be sorted by.

With the buttons “Home” and “End” you can switch between the outermost columns.
Pressing any key will refresh the window.
Press “q” to exit.
By pressing the “o” key, you will switch to showing only active processes, that is, only processes that write and read data from persistent storage. You can get the same result by running the program with the -o option:
Pressing the “o” key again will return the display of all processes.
Descending sorting is used by default, using the “r” button you can switch between descending and ascending sorting.
The “p” button toggles between displaying processes and streams.
By default, read and write speeds are shown, using the “a” button you can switch to displaying the total amount of written and read data.
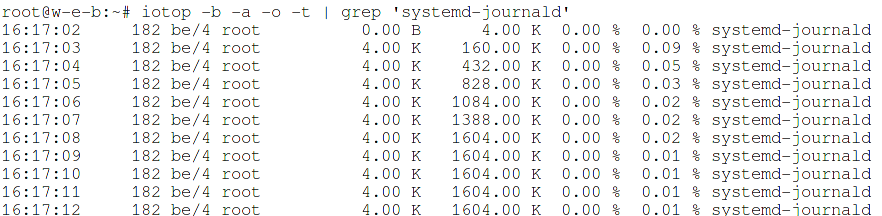
iotop has several options that allow you to control the behavior of the program, for example, the following command will work in batch mode (-b), showing the total amount of written and read data (-a) only for active processes (-o), to the output data will be appended timestamp (-t), only systemd-journald information will be filtered from all processes (grep ‘systemd-journald’):
iotop -b -a -o -t | grep 'systemd-journald'
pidstat – Display statistics for Linux tasks
The sysstat package contains two utilities at once with which you can collect statistics on disk usage by processes:
To install pidstat on Debian, Linux Mint, Kali Linux, Ubuntu and their derivatives, run the command:
To install pidstat on Arch Linux, BlackArch, Manjaro and their derivatives, run the command:
The next command will display the accumulated statistics for every 20 seconds, only active processes will be shown (that have made read and write operations to the disk during the specified interval), and the full command that started the process will also be shown. For more complete statistics, run the program with elevated privileges:
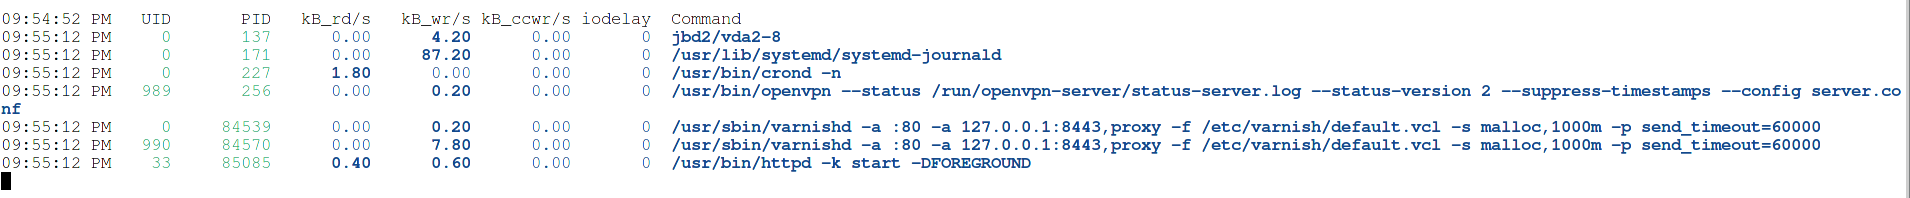
Each row will have the following columns:
- Time stamp
- UID: The real user identification number of the task being monitored.
- USER: The name of the real user owning the task being monitored.
- PID: The identification number of the task being monitored.
- kB_rd/s: Number of kilobytes the task has caused to be read from disk per second.
- kB_wr/s: Number of kilobytes the task has caused, or shall cause to be written to disk per second.
- kB_ccwr/s: Number of kilobytes whose writing to disk has been cancelled by the task. This may occur when the task truncates some dirty pagecache. In this case, some IO which another task has been accounted for will not be happening.
- iodelay: Block I/O delay of the task being monitored, measured in clock ticks. This metric includes the delays spent waiting for sync block I/O completion and for swapin block I/O completion.
- Command: The command name of the task.
iostat – statistics of using devices and disk partitions
The iostat utility is also included in the sysstat package. As you might guess from the name of the program, it generates reports on I/O statistics for devices and partitions. Its peculiarity is that it shows generalized statistics for the entire system, as well as for individual disks, without breaking it down into processes. The iostat program can come in handy when you need to answer the question: “Which of the persistent media is most loaded?”
Running the program without options
will display two blocks of information:
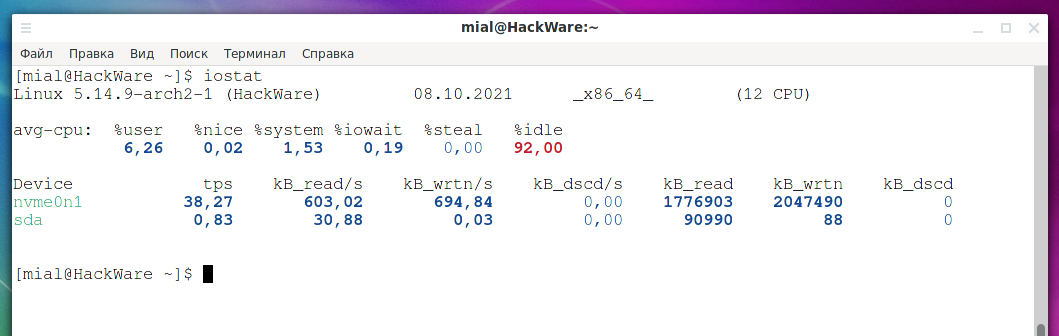
The section with device usage statistics contains the following columns:
- Device: This column gives the device (or partition) name as listed in the /dev directory.
- tps: Indicate the number of transfers per second that were issued to the device. A transfer is an I/O request to the device. Multiple logical requests can be combined into a single I/O request to the device. A transfer is of indeterminate size.
- kB_read/s: Indicate the amount of data read from the device expressed in a number of kilobytes per second. Blocks are equivalent to sectors and therefore have a size of 512 bytes.
- kB_wrtn/s: Indicate the amount of data written to the device expressed in a number of kilobytes per second.
- kB_dscd/s: Indicate the amount of data discarded for the device expressed in a number of kilobytes per second.
- kB_read: The total number of kilobytes read.
- kB_wrtn: The total number of kilobytes written.
- kB_dscd: The total number of kilobytes discarded.
The report is output for the entire system from the moment it was booted.
Since data is output in kilobytes by default, and modern volumes of information written to disk are usually multiples of a gigabyte, the numbers are difficult to read. To display numbers in human-readable units, use the -h option:

The -h option is the equivalent of specifying two options —human and —pretty at once, so if you are not completely satisfied with the appearance of the outputted report, then try using these options separately.
To display as much information as possible, use the -x option:
If you only want information about devices, then use the -d option:
You can run the command by specifying the interval time (in seconds) and the counter (number of reports) – in this case, the program will display information at the specified interval:
iostat INTERVAL iostat INTERVAL COUNTER
The first report will contain information from the moment the system was booted, and subsequent reports will contain information for the period since the previous report.
To find problems, you can use the following command, which will continuously print information:
With iostat, you can monitor the read and write speed of the entire device, as well as identify discarded blocks.