- How to List Running Processes in Linux
- Processes in Linux
- List Running Processes in Linux
- List Running Processes in Linux by Using the ps Command
- List Running Processes in Linux by Using the top Command
- List Running Processes in Linux by Using the htop Command
- List Running Processes in Linux by Using the atop Command
- Find Process IDs Using the pgrep Command
How to List Running Processes in Linux
Each application you use or a command you run on your Linux system creates a process or task. As a system administrator, you will need to manage processes to ensure optimal system performance.
In this tutorial, we will cover different Linux commands you can use to list and manage currently running processes.
- A system running Linux
- An account with root or sudo privileges
- Access to the terminal window/command line
Processes in Linux
Processes in Linux start every time you launch an application or run a command. While each command creates one process, applications create and run multiple processes for different tasks.
By default, each new process starts as a foreground process. This means it must finish before a new process can begin. Running processes in the background allows you to perform other tasks at the same time.
Note: Learn more about terminating Linux processes in our guide to killing processes in Linux.
List Running Processes in Linux
To list currently running processes, use the ps , top , htop , and atop Linux commands. You can also combine the ps command with the pgrep command to identify individual processes.
List Running Processes in Linux by Using the ps Command
The ps Linux command creates a snapshot of currently running processes. Unlike the other commands on this list, ps presents the output as a static list, not updated in real time.
The ps command uses the following syntax:
Frequently used ps command options include:
- a : List all ruining processes for all users.
- -A, -e : List all processes on the system.
- -a : List all processes except session leaders (instances where the process ID is the same as the session ID) and processes not associated with a terminal.
- -d : List all processes except session leaders.
- —deselect, -N : List all processes except those that fulfill a user-defined condition.
- f : Displays process hierarchy as ASCII art.
- -j : Displays output in the jobs format.
- T : List all processes associated with this terminal.
- r : Only list running processes.
- u : Expand the output to include additional information, for example, CPU and memory usage.
- -u : Define a user whose processes you want to list.
- x : Include processes without a TTY.
Note: Check the complete list of ps command options by using man ps .
Running the ps command without any options produces an output similar to:
The default output includes the following categories:
- PID: Process identification number.
- TTY: The type of terminal the process is running on.
- TIME: Total amount of CPU usage.
- CMD: The name of the command that started the process.
Using the combination of a , u , and x options results in a more detailed output:
The new categories of the expanded output include:
- USER: The name of the user running the process.
- %CPU: The CPU usage percentage.
- %MEM: The memory usage percentage.
- VSZ: Total virtual memory used by the process, in kilobytes.
- RSS: Resident set size, the portion of RAM occupied by the process.
- STAT: The current process state.
- START: The time the process was started.
To display the running processes in a hierarchical view, enter:
Note: When using more than one ps command option containing a dash symbol («—«), you only need to use one dash symbol before listing the options. For instance, to use the ps command with the -e and -f options, type ps -ef .
Filter the list of processes by user with:
ps -U [real user ID or name] -u [effective user ID or name] uFor example, showing a list of processes started by the user called phoenixnap:
ps -U phoenixnap -u phoenixnap uList Running Processes in Linux by Using the top Command
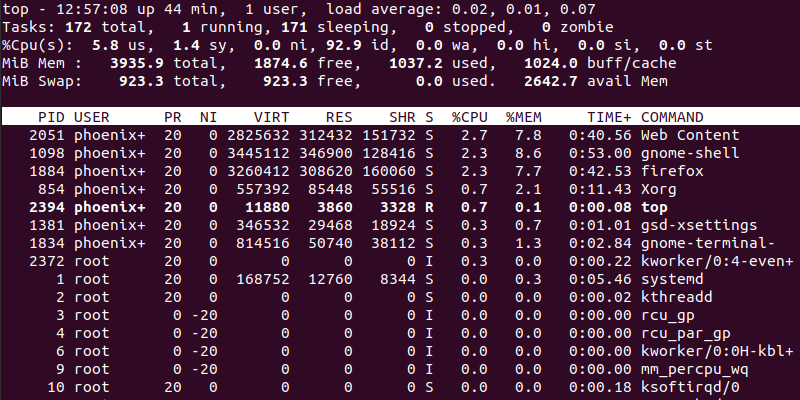
The top command displays the list of running processes in the order of decreasing CPU usage. This means that the most resource-heavy processes appear at the top of the list:
The output of the top command updates in real time, with the three-second default refresh rate. The top command output contains the following categories:
- PID: Process identification number.
- USER: The name of the user running the process.
- PR: The scheduling priority for the process.
- NI: The nice value of the process, with negative numbers indicating higher priority.
- VIRT: The virtual memory amount used by the process.
- RES: The resident (physical) memory amount used by the process.
- SHR: The total shared memory used by the process.
- S: The status of the process — R (running) or S (sleeping).
- %CPU: The percentage of CPU usage.
- %MEM: The memory usage percentage.
- TIME+: Total CPU usage amount.
- COMMAND: The name of the command that started the process.
While the top command is running, use the following options to interact with it or change the output format:
- c: Display the absolute process path.
- d: Change the output refresh rate to a user-defined value (in seconds).
- h: Display the help window.
- k: Kill a process by providing the PID.
- M: Sort the list by memory usage.
- N: Sort the list by PID.
- r: Change the nice value (priority) of a process by providing the PID.
- z: Change the output color to highlight running processes.
- q: Quit the command interface.
Note: Options for interacting with the top command are case-sensitive. Make sure you turn the Caps Lock off first.
List Running Processes in Linux by Using the htop Command
The htop command offers the same output as the top command but in an easier-to-understand and user-friendly way.
Since most Linux distributions don’t include this command, install it with:
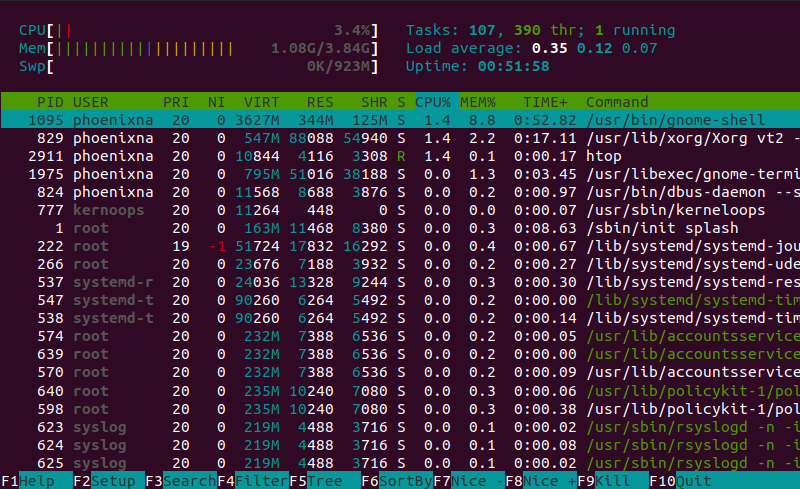
Using the htop command provides the following output:
Use the following keys to interact with the htop command:
- Directional keys: Scroll the process list vertically and horizontally.
- F1: Open the help window.
- F2: Open the htop command setup.
- F3: Search for a process by typing the name.
- F4: Filter the process list by name.
- F5: Switch between showing the process hierarchy as a sorted list or a tree.
- F6: Sort processes by columns.
- F7: Decrease the nice value (increase priority) of a process.
- F8: Increase the nice value (decrease priority) of a process.
- F9: Kill the selected process.
- F10: Exit the command interface.
List Running Processes in Linux by Using the atop Command
The atop command provides a more comprehensive overview of the running processes compared to the top command. Start by installing the atop command with:
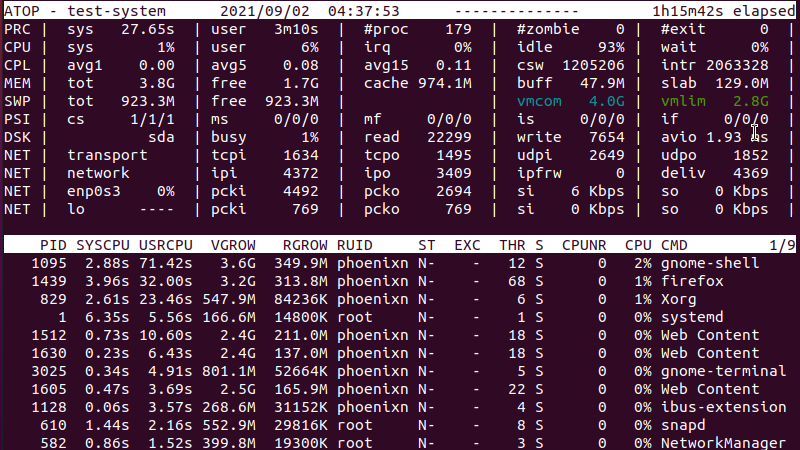
The atop command creates an output similar to:
The heading section of the command output provides an overview of system resources, including process and performance-related statistics and memory, disk, and network usage.
The lower section lists currently running processes and contains the following categories:
- PID: Process identification number.
- SYSCPU: The CPU usage by the process while system handling.
- USRCPU: The CPU usage by the process while running in user mode.
- VGROW: The amount of virtual memory the process has occupied since the last output update.
- RGROW: The amount of physical memory the process has occupied since the last output update.
- RUID: The real user ID of the user that started the process.
- ST: The current process status.
- EXC: The exit code after the process terminates.
- THR: The number of threads the process is using.
- S: The current status of the primary thread of the process.
- CPUNR: The number of CPUs used by the process.
- CPU: The CPU percentage used by the process.
- CMD: The name of the command that started the process.
Using the atop command with the following options changes the output format:
- -a : Show active processes only.
- -c : Show command line per process.
- -d : Show disk information.
- -l : Show total values as average-per-second.
- -m : Show memory information.
- -n : Show network information.
- -s : Show process scheduling information.
- -v : Show the verbose output.
- -y : Show individual threads.
Use the following flags to interact with the atop command:
- a: Sort by most active resources.
- c: Sort by CPU consumption.
- d: Sort by disk activity.
- m: Sort by memory usage.
- n: Sort by network activity.
Find Process IDs Using the pgrep Command
Using the pgrep command allows you to search for a specific process. The pgrep command uses the following syntax:
For instance, use the following command to search for the firefox process:
The command output lists the PID of the process:
Using this PID with the ps command allows you to get more information on the process. In this example, using the PID 1439 provides information on the firefox process:
After reading this tutorial, you should be able to use the ps , top , htop , and atop commands to list and manage running processes in Linux.
Use the available command options to customize the output and command behavior.


