Monitor your Java on Linux with jconsole
The Java Development Kit (JDK) provides binaries, tools, and compilers for the development of Java applications. One helpful tool included is jconsole.
To demonstrate, I will use the WildFly J2EE application server, which is part of the JBOSS open source application server project. First, I start up a standalone instance.
~/wildfly/24.0.1/bin$ ./standalone.sh ========================================================================= JBoss Bootstrap Environment JBOSS_HOME: /home/alan/wildfly/24.0.1 JAVA: /usr/lib/jvm/java-11-openjdk-11.0.11.0.9-5.fc34.x86_64/bin/java Now, in another terminal, I type jconsole .
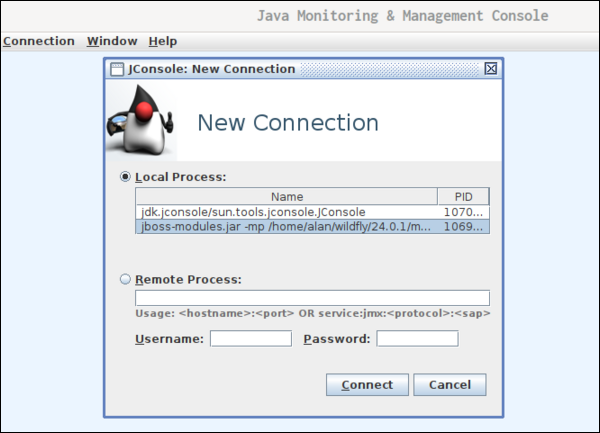
Upon launching, jconsole lists local instances. Select Local Process, then select the name of the process and click Connect. That is all it takes to connect and begin using jconsole with a running Java Virtual Machine (JVM).
Overview
The Java Monitoring and Management Console shows the process identifier (PID) at the top of the dashboard. The Overview tab has four graphs to show the vitals for Heap Memory Usage, Threads, Classes, and CPU Usage.
Check Java processes on Linux with the jps command
With many processes running on a system, it’s useful to have a quick way to identify only Java with the jps command.
On Linux, there are commands to view processes running on your system. A process is any ongoing event being managed by the kernel. A process is spawned when you launch an application, but there are also many other processes running in the background of your computer, including programs to keep your system time accurate, to monitor for new filesystems, to index files, and more. The utilities, such as those included in the procps-ng package, that monitor these processes tend to be intentionally generic. They look at all processes on your computer so you can filter the list based on what you need to know.
On Linux, you can view processes with the ps command. It is the simplest way to view the running processes on your system.
$ ps PID TTY TIME CMD 4486 pts/0 00:00:00 bash 66930 pts/0 00:00:00 psYou can use the ps command to view running Java processes on a system also by piping output to grep .
$ ps ax |grep java 67604 pts/1 Sl+ 0:18 /usr/lib/jvm/java-11-openjdk-11.0.12.0.7-4.fc34.x86_64/bin/java -D[Standalone] -server -Xms64m -Xmx512m -XX:MetaspaceSize=96M -XX:MaxMetaspaceSize=256m -Djava.net.preferIPv4Stack=true -Djboss.modules.system.pkgs=org.jboss.byteman -Djava.awt.headless=true --add-exports=java.desktop/sun.awt=ALL-UNNAMED --add-exports=java.naming/com.sun.jndi.ldap=ALL-UNNAMED --add-opens=java.base/java.lang=ALL-UNNAMED --add-opens=java.base/java.lang.invoke=ALL-UNNAMED --add-opens=java.base/java.io=ALL-UNNAMED --add-opens=java.base/java.security=ALL-UNNAMED --add-opens=java.base/java.util=ALL-UNNAMED --add-opens=java.management/javax.management=ALL-UNNAMED --add-opens=java.naming/javax.naming=ALL-UNNAMED -Dorg.jboss.boot.log.file=/home/alan/wildfly/24.0.1/standalone/log/server.log -Dlogging.configuration=file:/home/alan/wildfly/24.0.1/standalone/configuration/logging.properties -jar /home/alan/wildfly/24.0.1/jboss-modules.jar -mp /home/alan/wildfly/24.0.1/modules org.jboss.as.standalone -Djboss.home.dir=/home/alan/wildfly/24.0.1 -Djboss.server.base.dir=/home/alan/wildfly/24.0.1/standaloneOpenJDK, however, has its very own specific process monitor. The Java Virtual Machine Process Status (jps) tool allows you to scan for each running instance of the Java Virtual Machine (JVM) on your system.
To view a similar output as seen in the ps command, use the -v option. This is useful, partly because it requires less typing.
$ jps -v 67604 jboss-modules.jar -D[Standalone] -Xms64m -Xmx512m -XX:MetaspaceSize=96M -XX:MaxMetaspaceSize=256m -Djava.net.preferIPv4Stack=true -Djboss.modules.system.pkgs=org.jboss.byteman -Djava.awt.headless=true --add-exports=java.desktop/sun.awt=ALL-UNNAMED --add-exports=java.naming/com.sun.jndi.ldap=ALL-UNNAMED --add-opens=java.base/java.lang=ALL-UNNAMED --add-opens=java.base/java.lang.invoke=ALL-UNNAMED --add-opens=java.base/java.io=ALL-UNNAMED --add-opens=java.base/java.security=ALL-UNNAMED --add-opens=java.base/java.util=ALL-UNNAMED --add-opens=java.management/javax.management=ALL-UNNAMED --add-opens=java.naming/javax.naming=ALL-UNNAMED -Dorg.jboss.boot.log.file=/home/alan/wildfly/24.0.1/standalone/log/server.log -Dlogging.configuration=file:/home/alan/wildfly/24.0.1/standalone/configuration/logging.propertiesThe default jps output provides the process identifier and the class name or Jar file name of each detected instance.
$ jps 67604 jboss-modules.jar 69430 JpsNote: The man page for jps states that it is experimental and unsupported. Still, it’s a nice-to-have option because often many processes are running on a system, and having a quick way to identify only Java is useful.
Because Java is still a popular language today, being familiar with the Java Development Kit and Runtime Environment remains important. They contain many tools applicable to the development and maintenance of Java applications.
Install Java manually on Linux
Manual installation provides the user with the highest level of control over the Java runtime environment.


