System Monitor
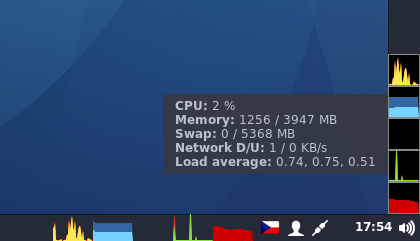

This applet uses glibtop to get system resources usage statistics and displays them in graphs and also as text in tooltip.
All graph colors and sizes are configurable. Color settings support alpha channel, for ex. setting background alpha to 0 can make the background transparent.
Cinnamon settings API is used. All changes are applied on the fly and it is not necessary to restart the Cinnamon.
Installing glibtop
sudo apt-get install gir1.2-gtop-2.0sudo dnf install libgtop2CHANGELOG
1.6.5
- Fixed crash in network provider when glibtop failed to retrieve network interface list and a fallback method was used
1.6.4
- Fixed memory leak
- Applet now uses one drawing area for all graphs, it should reduce drawing overhead
1.6.3
- Fixed rendering, it should be pixel perfect now
- Added option to show decimal value as CPU usage in the tooltip
1.6.2
1.6.1
- Fixed an issue with applet not loading on some distributions due to a missing function GTop.glibtop.get_netlist
1.6
- Added support for vertical panels
- Applet checks for missing dependency on startup (glibtop) and asks the user to install it instead of just failing to load
1.5
1.4
1.3
1.2
1.1
1.0
Log In To Comment!
30 Comments
This was regularly causing my entire system to freeze for some reason. It took me a long time to figure out what was potentially causing it. Some days have passed and the issue seems to have stopped ever since I uninstalled it.
Don’t work on my ubuntu 22.04, gir1.2-gtop-2.0 is installed, but applet says it is not. How can I debug it?
Hi there, just wanted to say I use it as default system monitor in the task bar. Great tool, thank you for developing it.
Now that I have been using your applet a little longer I have some additional suggestions. It would be nice to add horizontal grid lines to the CPU chart dividing it into as many horizontal segments as there are CPU cores. It might also make sense to add horizontal grid lines delineating GB in the memory chart. Feel free to make this optional with a switch in the configuration.
I have just installed you applet and have some suggestions. If possible I would like to see an option to integrate your current memory and swap graphs into a single graph with free memory represented in the graph as well. Beyond that I would also find it useful to have a graph for disk activity. Thank you for your applet.
I’m confused. I’m really confused. I just installed this in my Mint 19.1. The app is showing me little squiggly graphoids in the panel in different colors. What do these things all mean? Which graphs are which? Color significance? I’m completely in the dark. I don’t see any doc or help anywhere.. Is there any documentation? Where can I find it. I could sure use it. Am I a dunderbrain who just hasn’t caught the vibe? Help!
Just hover your mouse over it, wait a little bit, a tooltip shows up, giving you more information, Note that you can also change colors by selecting «Configure. » from right click menu which apears after right-clicking the graphs
After Mint upgrade to 20.1 which comes with Cinnamon 4.8 (based on MozJS78) the applet no longer start, and makes Cinnamon crash in case of system start when it’s enabled. Not sure it’s an issue with applet or with Cinnamon, but I’m unable to use it. Tried updating, removing, resetting its settings and Cinnamon settings — no luck.
Updating Cinnamon CJS package solved the issue! Updated, rebooted, removed and added back the applet — now it works fine. See also https://github.com/linuxmint/cinnamon-spices-applets/issues/3416
Alright, there is the Multi-Core System Monitor as downloadable applet, but I liked the good old colored system monitor better.
Seems newer version doesn’t show call out when hovering pointer above applet. Am I missing something?
Thanks for this applet. Just a FYI in case it helps others — I did need to restart Cinnamon in order to get the applet to work.
Hello guys. Im newbie in linux, just learning. I’ve installed the package as the instructions above, and i got this result. It returned a success installation, right? Why can’t I find it on my start menu?: Reading package lists. Done Building dependency tree Reading state information. Done gir1.2-gtop-2.0 is already the newest version (2.38.0-2ubuntu0.18.04.1). The following package was automatically installed and is no longer required: libcpufreq0 Use ‘sudo apt autoremove’ to remove it. 0 upgraded, 0 newly installed, 0 to remove and 78 not upgraded.
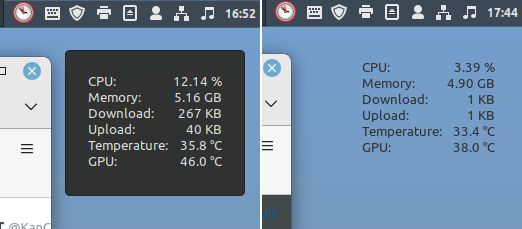
Simple system monitor

Edit .local/share/cinnamon/desklets/simple-system-monitor@ariel/metadata.json
Specify a appropriate file path to «thermal-file»:
Example: Ryzen CPU is «/sys/devices/pci0000:00/0000:00:18.3/hwmon/hwmon2/temp1_input»
«GPU» shows incorrect value
Edit .local/share/cinnamon/desklets/simple-system-monitor@ariel/metadata.json
Specify a appropriate file path to «thermal-file-gpu»:
Example: Radeon GPU is «/sys/devices/pci0000:00/0000:00:03.1/0000:06:00.0/hwmon/hwmon1/temp1_input»
Change font color
Edit .local/share/cinnamon/desklets/simple-system-monitor@ariel/4.0/stylesheet.css
Add «color:» to «.mainContainer»
Example: color: rgba(255, 144, 0, 1.0);
Change font size
Edit .local/share/cinnamon/desklets/simple-system-monitor@ariel/4.0/stylesheet.css
Add «font-size:» to «.mainContainer»
Change background color
Edit .local/share/cinnamon/desklets/simple-system-monitor@ariel/4.0/stylesheet.css
Add «background-color:» to «.mainContainer»
Example: background-color: rgba(90, 90, 90, 1.0);
Change background color to transparent
Edit .local/share/cinnamon/desklets/simple-system-monitor@ariel/metadata.json
Set «prevent-decorations» to true
Example: «prevent-decorations»: true,
Back to previous layout
Edit .local/share/cinnamon/desklets/simple-system-monitor@ariel/4.0/stylesheet.css
Set «text-align: right» to «.title»
Set «text-align: left» to «.value»
Log In To Comment!
52 Comments
Values are incorrect: regular system monitor/psensors vs. this desklet CPU 70% vs. 38% RAM 7.2 G vs 6.7G Temp 39 C vs 71 C Linux Mint 21 x86_64 Cinnamon 5.4.12
seems to freeze after a while (no change of CPU, RAM or temperature) Linux Mint 21 x86_64 Cinnamon 5.4.12
Mint Desktop, open Start-Menu. Type ‘desklets’ and open it. Go to ‘Download’. Search for ‘simple system monitor’. Install and done.
To make the background transparent I edited the metadata.json file at: /home/yourusername/.local/share/cinnamon/desklets/simple-system-monitor@ariel I changed «prevent-decorations» from ‘false’ to ‘true’. Then pressed Alt+F2 to open the Dialog Window and typed ‘r’ to restart Cinnamon.
On Linux Mint 20.2 all is working except temperature with AMD Ryzen 2700 CPU. Found that thermal_zone file did not exist. Replaced thermal-file path with /sys/devices/pci0000:00/0000:00:18.3/hwmon/hwmon1/temp1_input and now temperature is being reported correctly. Thank you for a very useful desklet.
Version 1.0.1 (2021-04-10 14:00:03) I must have my fonts larger than you expect them to be. I had to change the stylesheet.css for mainContainer to be 220px wide. Otherwise the labels abbreviated and values truncated. In Mint 20.1 Cinnamon the desklets installer also warns «This desklet contains function calls that could potentially cause Cinnamon to crash or freeze.» Not sure if that just typical because you access some hardware that isn’t common to desklets? got me! A version for Fahrenheit would be nice.
Working fine on Linux Mint 20.1 Just run on a console: sudo xed /home/yourusername/.local/share/cinnamon/desklets/simple-system-monitor@ariel/metadata.json and change at thermal-file from thermal_zone0 to thermal_zone2 and save the file. Then restart your computer.
Working fine on Linux mint 20.1 Just run on a console: sudo xed /home/yourusername/.local/share/cinnamon/desklets/simple-system-monitor@ariel/metadata.json and change at thermal-file from thermal_zone0 to thermal_zone2
Tja, jahrelang läuft es mit LM 18.3 stabil vor sich hin — und dann dieses Update. Bitte den Fehler fixen. Bei der Gelegenheit auch bitte an die Temperaturanzeige für AMD Systeme zum laufen bringen. DANKE
Installed it on a new Linux Mint 20. CPU, Memory, Download and Upload stats seems to be updated in real time, except the temperature stat. It shows a constant 25C, but when I checked using terminal, «inxi -Fxz», I got the following thermal data: Sensors: System Temperatures: cpu: 48.0 C mobo: 47.0 C sodimm: 39.0 C
I feel it doesn’t work very accurately on Mint 9.3 Cinnamon. I had it installed a while, and it ‘looked’ to be working, but then I got to feel that it wasn’t giving me the right information. The Temperature seems to be low all the time and I knew by the heat coming from the fan at times, that it actually increased. The CPU % also appeared to stay low, even when the computer was working on CPU intensive tasks. So, I ran htop for a day on screen and compared. The Memory reading seems accurate enough, but the CPU was way off, I could be pegging out the cpus and the desklet was saying it was only using a small percentage. And during that time, the temperature didn’t rise. in a laptop! So, as much as it is a great idea, I feel that something isn’t quite right on my set-up.
Мониторинг
Программы мониторинга системы для Linux. Программы для отслеживания использования системных ресурсов.
btop
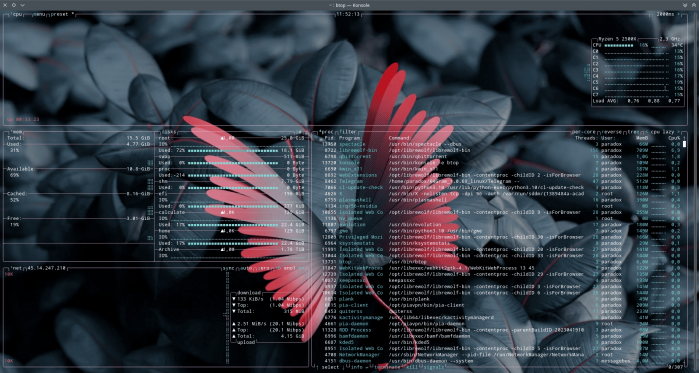
Btop — монитор ресурсов. Показывает использование и статистику по процессору, памяти, дискам, сети, процессам.
nvtop
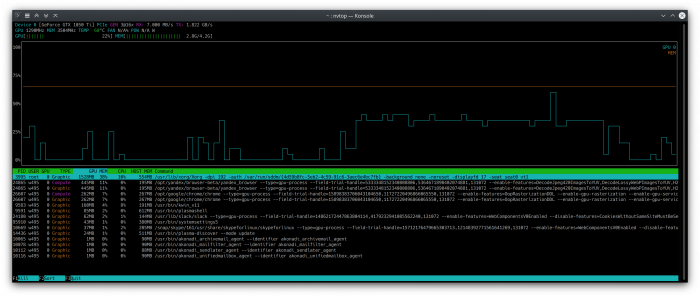
nvtop (NVidia Top) — консольная утилита для мониторинга состояния видео-карт Nvidia. Выводит состояние памяти, температуру, список процессов, график использования и другую информацию.
GSmartControl
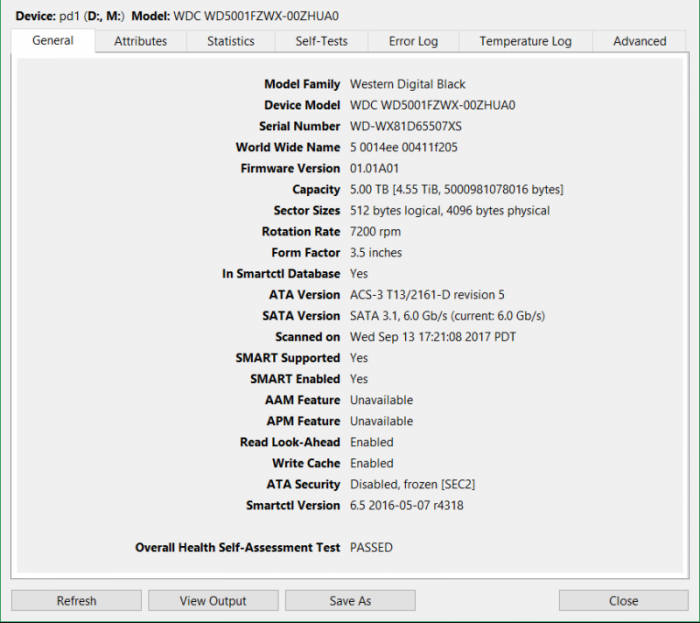
GSmartControl — утилита для мониторинга состояния, отображения статуса и настройки параметров жестких дисков и SSD. Является графическим интерфейсом для утилиты smartctl.
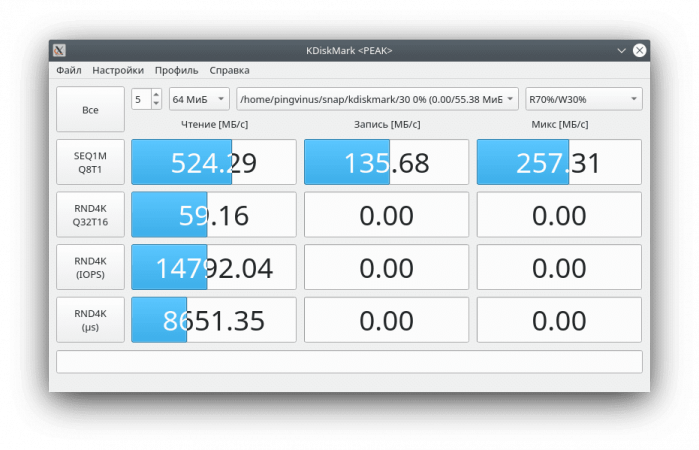
KDiskMark
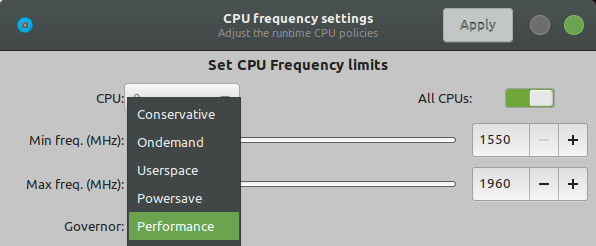
Cpupower-gui
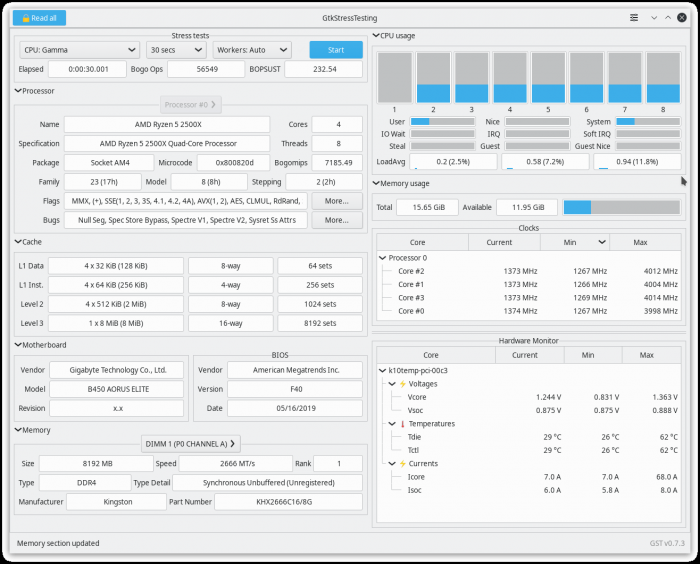
GtkStressTesting
GreenWithEnvy
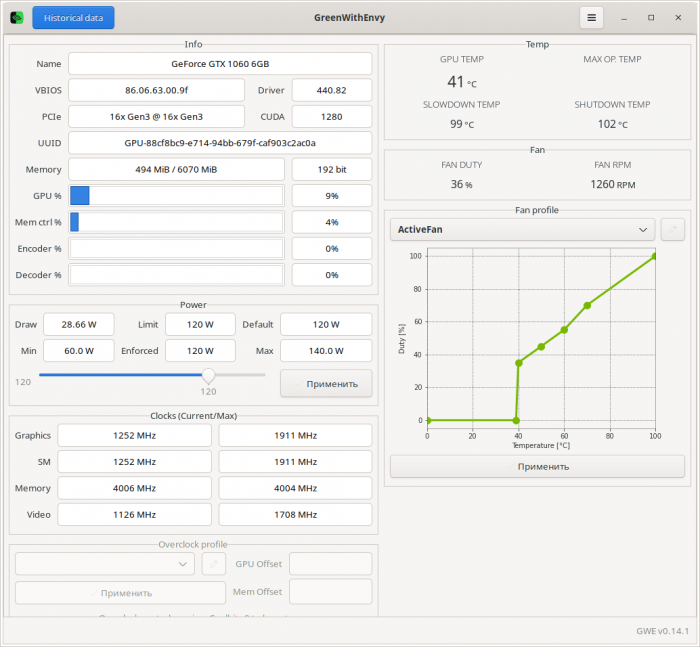
GreenWithEnvy (GWE) — утилита для разгона, управления скоростью вращения вентиляторов, получения информации видео-карт от NVIDIA.
Glances
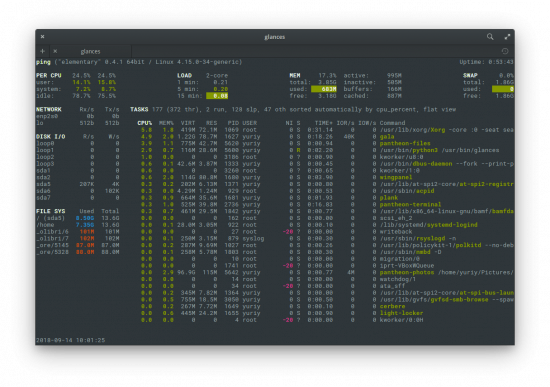
Glances — консольный монитор системных ресурсов, который отображает максимум информации на одном экране.
Top
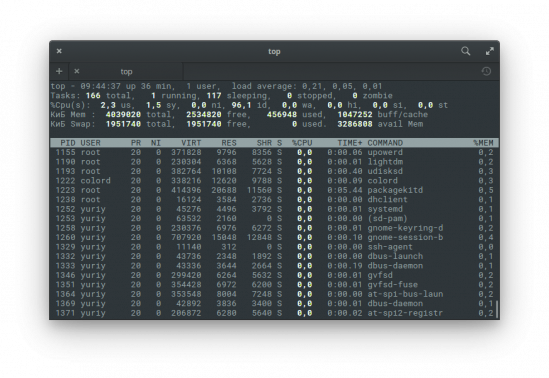
Top — консольный таск-менеджер для Linux. Позволяет просматривать информацию о процессах и загруженности ресурсов.
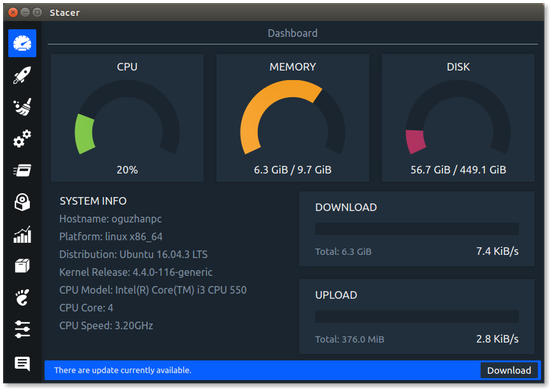
Stacer
CPU-X
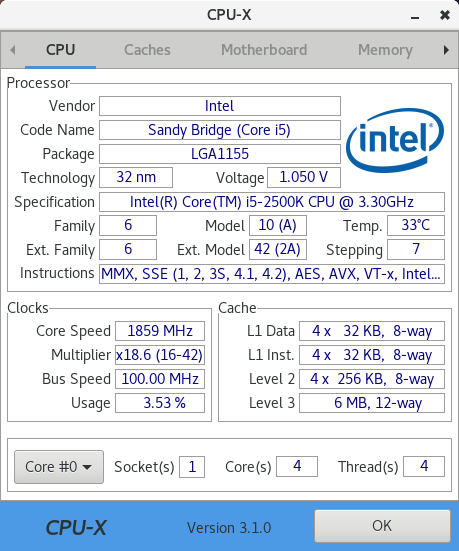
CPU-X — программа для просмотра основной информации о комьютере (процессор, кэш, материнская плата, оперативная память, операционная система, графическая подсистема).
Psensor
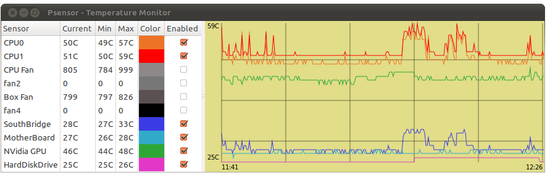
Psensor — простая утилита с графическим интерфейсом для мониторинга температуры оборудования компьютера.