- Как пользоваться командами ping и tracert
- Команда ping
- Как пользоваться ping
- Если у вас Windows
- Если у вас Linux
- Если у вас MacOS
- Команда tracert
- Как запустить tracert
- Если у вас Windows
- Если у вас Linux
- Если у вас MacOS
- Популярные статьи
- Ping, traceroute, and netstat: The network troubleshooting trifecta
- Ping
- Great Linux resources
- Traceroute
- Netstat
- Conclusion
Как пользоваться командами ping и tracert
В статье мы расскажем, для чего нужны утилиты ping и tracert, как запустить эти утилиты, а также приведем примеры команды ping для диагностики сети.
Ping и tracert — это утилиты для проверки целостности соединений в сетях и определения маршрутов следования данных на основе TCP/IP. Без этих утилит не обойтись не только при администрировании серверов (или целой сети), но и в условиях «домашней» диагностики.
Команда ping
Команда ping — один из базовых инструментов для работы с сетью. С помощью ping можно проверить сервер и его доступность с любого компьютера, а также соединение между устройствами.
Если вы задавались вопросом «Как я могу узнать мой IP адрес и порт?», то мы дадим вам ответ: командой пинг можно как узнать порт компьютера, так и определить его IP.
Также с помощью команды ping можно выполнить такие диагностические задачи, как:
- измерить время взаимодействия между двумя хостами;
- проверить IP-адрес конкретного хоста в локальной и глобальной сети;
- автоматически проверить сетевое устройство (например, когда ping является частью bash-скрипта);
- проверить пинг до сервера и др.
Как пользоваться ping
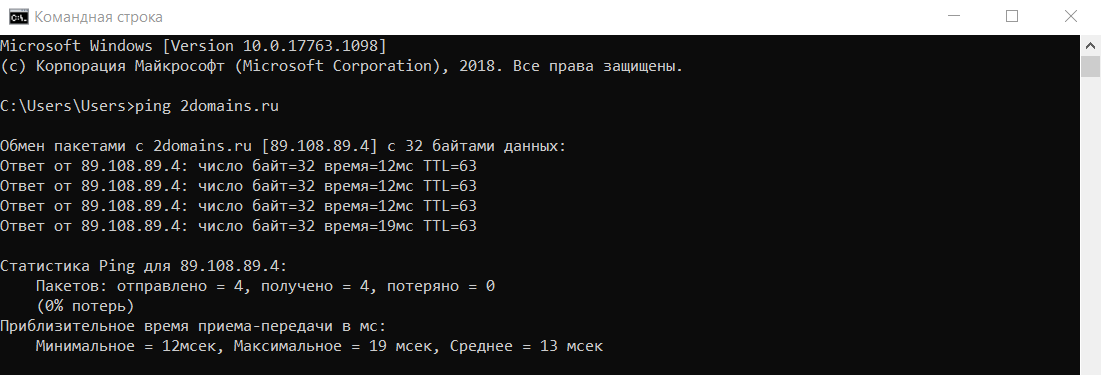
Если у вас Windows
- Откройте меню «Пуск», кликните по пункту Выполнить или нажмите сочетание клавиш Win+R.
- В поиске введите команду «cmd» и кликните Enter.
- В окне терминала введите команду:
ping имя_сайта (домен) или ping IP_сервера .
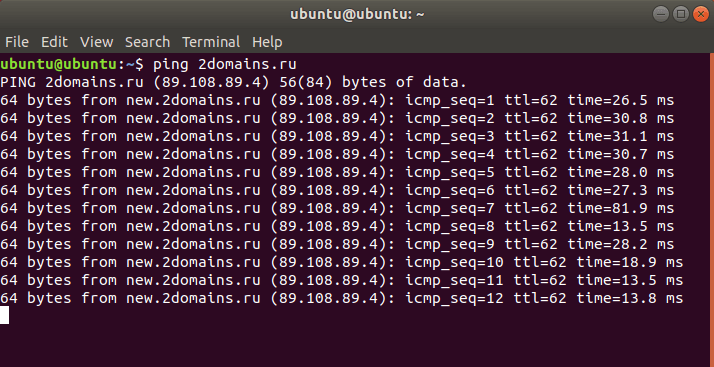
Если у вас Linux
1. Откройте терминал. Для этого:
- в Unity (Ubuntu): перейдите в «Главное меню» и введите слово «Терминал» в поисковой строке или наберите сочетание клавиш Ctrl+Alt+T;
- в Xfce (Xubuntu): перейдите в «Главное меню» — «Приложения», затем выберите «Система» — «Терминал»;
- в KDE (Kubuntu): перейдите в «Главное меню» — «Приложения», затем выберите «Система» — «Терминал».
2. В окне терминала введите команду:
ping имя_сайта (домен) или ping IP_сервера .
Если у вас кириллический домен
Для Windows и Linux кириллические домены нужно вводить в формате Punycode. Перевести домен в формат Punycode можно через сервис. Сконвертируйте имя кириллического домена и вставьте его в окно терминала следующим образом: ping xn--2-8sble8ahe.xn--p1ai
Если у вас MacOS
- В Spotlight выберите и запустите сетевую утилиту Network Utility.
- В открывшемся окне перейдите на нужную вкладку.
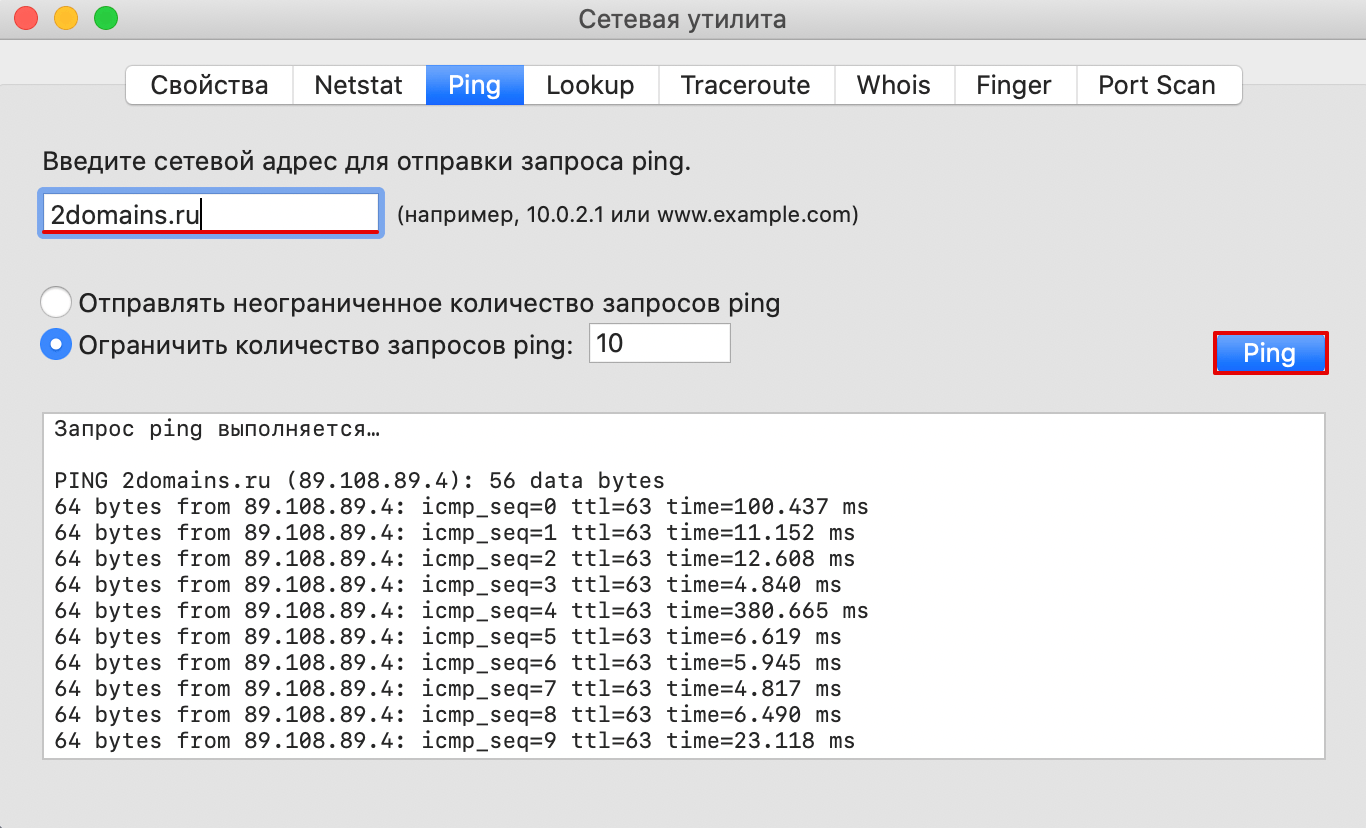
На вкладке Ping введите имя домена (или IP-адрес) и кликните Отследить:
Готово, вы запустили утилиту ping.
Команда tracert
Команда tracert – самый популярный инструмент сетевой диагностики. С помощью tracert можно проверить путь запроса к серверу и выявить проблемы, связанные с доступностью удаленного сервера. Сообщения отправляются с эхо-запросом по протоколу ICMP, и после каждой передачи выводится сообщение с эхо-ответом.
Командой tracert можно проверить:
- маршрут от локального компьютера до удаленного узла;
- количество узлов в сети;
- время прохождения пакета до конечного, транзитного и промежуточного узлов;
- точку потери пакета;
- пинг порта через командную строку.
Как запустить tracert
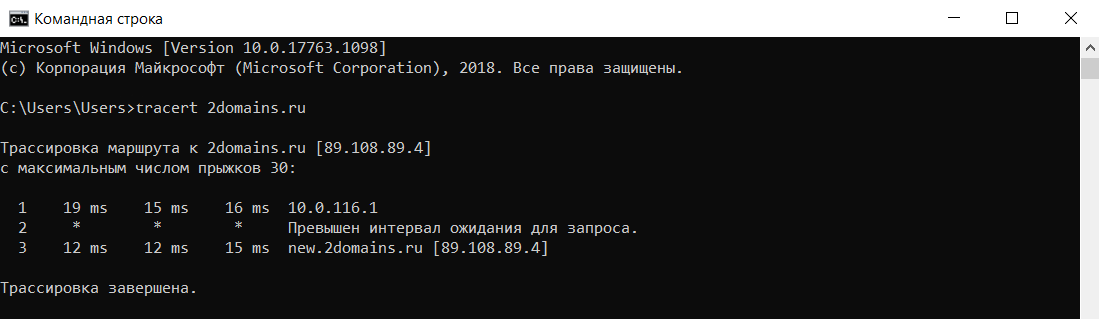
Если у вас Windows
- Откройте меню «Пуск», кликните по пункту Выполнить или нажмите сочетание клавиш Win + R.
- В поиске введите команду «cmd» и кликните Enter.
- В открывшемся окне терминала введите команду:
tracert имя_сайта (домен) или tracert IP_сервера .
Если у вас Linux
1. Откройте терминал. Для этого:
- в Unity (Ubuntu): перейдите в «Главное меню» и введите слово «Терминал» в поисковой строке или нажмитесочетание клавиш Ctrl+Alt+T;
- в Xfce (Xubuntu): перейдите в «Главное меню» — «Приложения», затем выберите «Система» — «Терминал»;
- в KDE (Kubuntu): перейдите в «Главное меню» — «Приложения», затем выберите «Система» — «Терминал».
2. В окне терминала введите команду:
traceroute имя_сайта (домен) или traceroute IP_сервера .
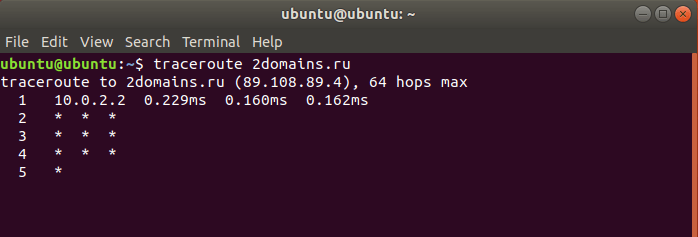
Если у вас MacOS
- В Spotlight выберите и запустите сетевую утилиту Network Utility.
- В открывшемся окне перейдите на нужную вкладку.
На вкладке Traceroute введите имя домена (или IP-адрес) и кликните Отследить:
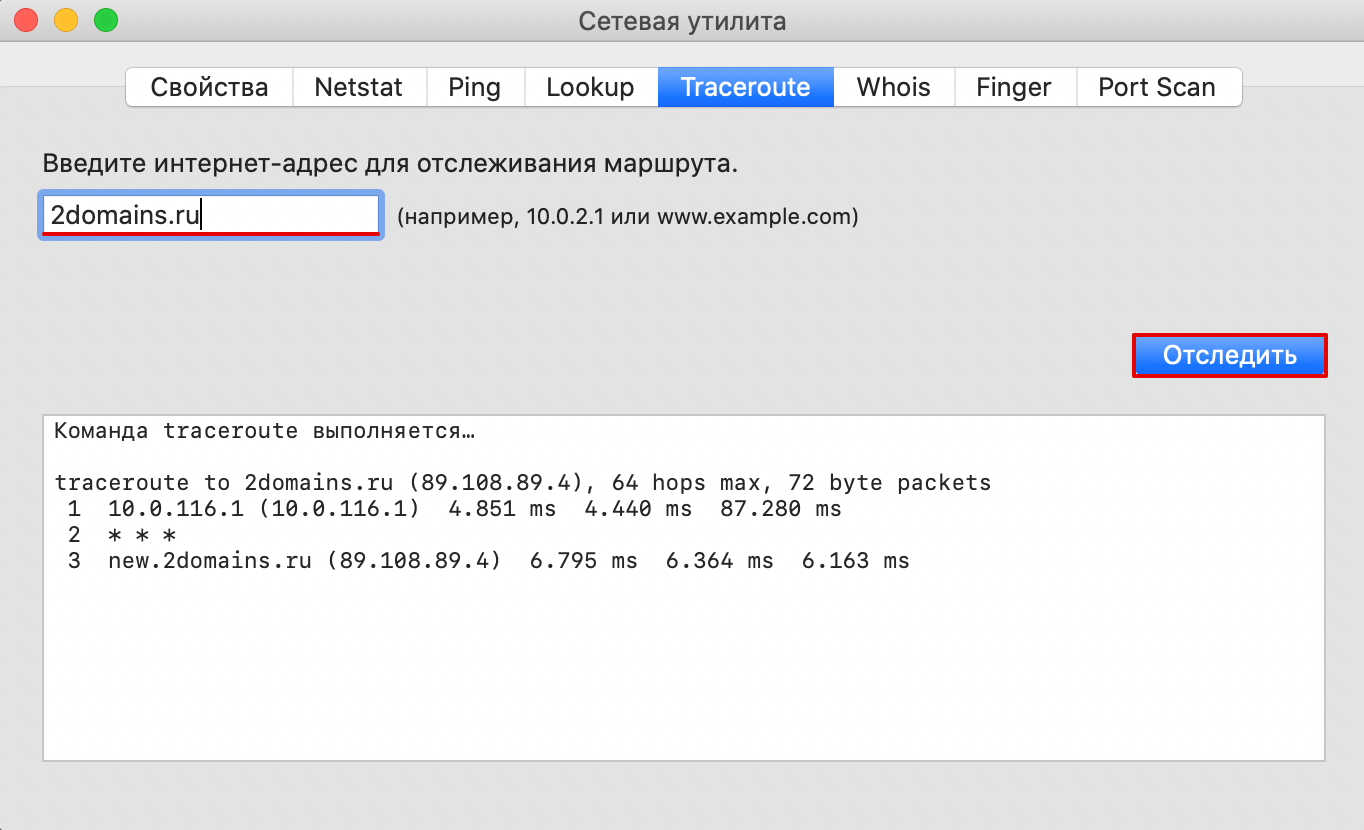
Готово, вы запустили утилиту tracert.
Если у вас установлена ОС Windows и вы хотите упростить диагностику подключения, скачайте утилиту WinMTR. Как пользоваться WinMTR, читайте на тематических блогах.
Популярные статьи
- Как указать (изменить) DNS-серверы для домена
- Я зарегистрировал домен, что дальше
- Как добавить запись типа A, AAAA, CNAME, MX, TXT, SRV для своего домена
- Что такое редирект: виды и возможности настройки
- Как создать почту со своим доменом
Ping, traceroute, and netstat: The network troubleshooting trifecta

I’ve spent a career building networks and servers, deploying them, troubleshooting them, and caring for applications. When there’s a network problem, be it outages or failed deployments (or you’re just plain curious about how things work), three simple tools come to mind: ping , traceroute , and netstat .
Ping
Great Linux resources
The ping command is one of the most well-known tools available. Simply put, ping sends an «are you there?» message to a remote host. If the host is, in fact, there, ping returns a «yup, I’m here» message. It does this using a protocol known as ICMP, or Internet Control Message Protocol. ICMP was designed to be an error reporting protocol and has a wide variety of uses that we won’t go into here.
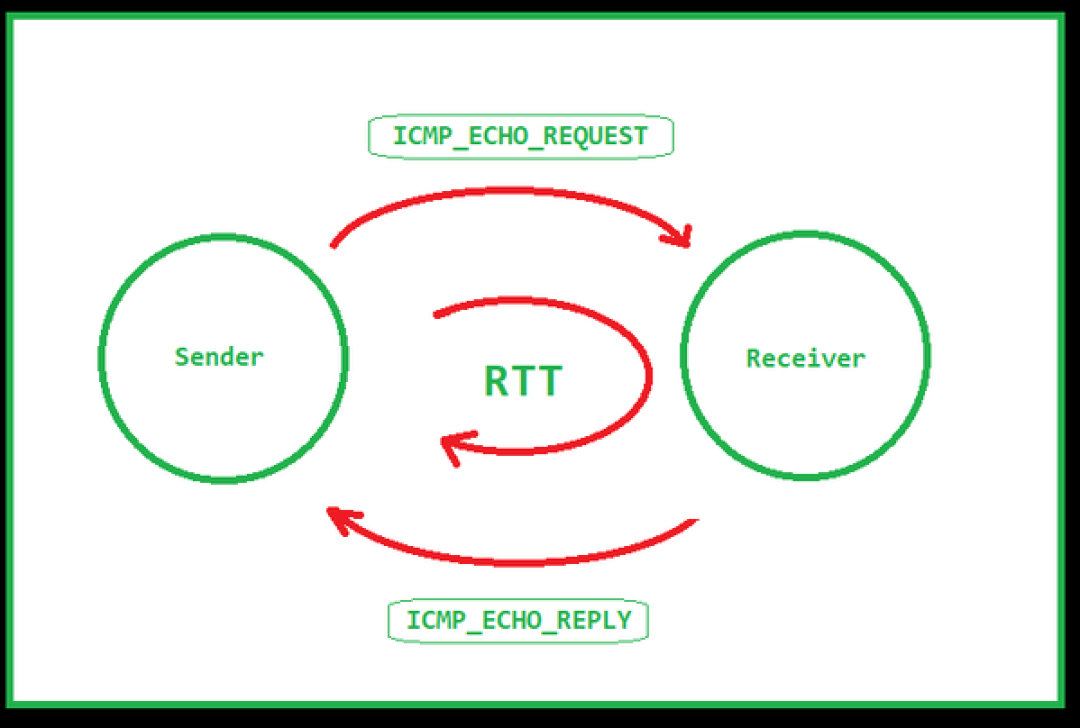
Ping uses two ICMP message types: type 8 (Echo Request) and type 0 (Echo Reply). When you issue a ping command, the source sends an ICMP Echo Request to the destination. If the destination is available and is allowed to respond, then it replies with an ICMP Echo Reply. Once the message returns to the source, the ping command displays a success message as well as the Round Trip Time (RTT). The RTT can be an indicator of the latency between the source and the destination.
Note: ICMP is typically a low-priority protocol, meaning that the ICMP RTT is not guaranteed to match the RTT for a higher-priority protocol such as TCP.
When the ping command completes, it displays a summary of the ping session. This summary tells you how many packets were sent and received, how much packet loss there was, and statistics on the RTT of the traffic. Ping is an excellent first step for identifying whether or not a destination is «alive.» Keep in mind, however, that some networks block ICMP traffic, so a failure to respond is not a guarantee that the destination is offline.
$ ping google.com PING google.com (172.217.10.46): 56 data bytes 64 bytes from 172.217.10.46: icmp_seq=0 ttl=56 time=15.740 ms 64 bytes from 172.217.10.46: icmp_seq=1 ttl=56 time=14.648 ms 64 bytes from 172.217.10.46: icmp_seq=2 ttl=56 time=11.153 ms 64 bytes from 172.217.10.46: icmp_seq=3 ttl=56 time=12.577 ms 64 bytes from 172.217.10.46: icmp_seq=4 ttl=56 time=22.400 ms 64 bytes from 172.217.10.46: icmp_seq=5 ttl=56 time=12.620 ms ^C --- google.com ping statistics --- 6 packets transmitted, 6 packets received, 0.0% packet loss round-trip min/avg/max/stddev = 11.153/14.856/22.400/3.689 msThe example above shows a ping session to google.com. From the output, you can see the IP address being contacted, the sequence number of each packet sent, and the round-trip time. In this case, six packets were sent with an average RTT of 14ms.
One thing to note about the output above and the ping utility, in general, is that ping is strictly an IPv4 tool. If you’re testing in an IPv6 network you’ll need to use the ping6 utility. Ping6 behaves roughly identical to the ping utility with the exception that it uses IPv6.
Traceroute
Traceroute is a finicky beast. This tool is meant to identify the path between a source and a destination point. The reality is mostly true, with a couple of caveats. Let’s start by explaining how traceroute works:

Think of traceroute as a string of ping commands. At each step along the path, traceroute identifies the hop’s IP as well as the latency to that hop. But how is it finding each hop? Turns out, it’s using a bit of trickery.
Traceroute uses UDP or ICMP, depending on the OS. On a typical *nix system it uses UDP and sends traffic to port 33434 by default. On a Windows system, traceroute uses ICMP. As with ping , traceroute can be blocked by not responding to the protocol/port being used.
When you invoke traceroute , you identify the destination you’re trying to reach. The command begins by sending a packet to the destination, but it sets the packet’s time to live (TTL) to one. This behavior is significant because the TTL value determines how many hops a packet is allowed to pass through before an ICMP Time Exceeded message is returned to the source. The trick here is to start the TTL at one and increment it by one after the ICMP message is received:
$ traceroute google.com traceroute to google.com (172.217.10.46), 64 hops max, 52 byte packets 1 192.168.1.1 (192.168.1.1) 1747.782 ms 1.812 ms 4.232 ms 2 10.170.2.1 (10.170.2.1) 10.838 ms 12.883 ms 8.510 ms 3 xx.xx.xx.xx (xx.xx.xx.xx) 10.588 ms 10.141 ms 10.652 ms 4 xx.xx.xx.xx (xx.xx.xx.xx) 14.965 ms 16.702 ms 18.275 ms 5 xx.xx.xx.xx (xx.xx.xx.xx) 15.092 ms 16.910 ms 17.127 ms 6 108.170.248.97 (108.170.248.97) 13.711 ms 14.363 ms 11.698 ms 7 216.239.62.171 (216.239.62.171) 12.802 ms 216.239.62.169 (216.239.62.169) 12.647 ms 12.963 ms 8 lga34s13-in-f14.1e100.net (172.217.10.46) 11.901 ms 13.666 ms 11.813 msTraceroute displays the ICMP message’s source address as the name of the hop and moves on to the next hop. When the source address finally matches the destination address, traceroute knows that it has reached the destination. It then outputs the full route from the source to the destination with the RTT for each hop. As with ping , the RTT values shown are not necessarily representative of the real RTT to a service such as HTTP or SSH. Traceroute, like ping , is considered to be lower priority compared to other traffic, so RTT values aren’t guaranteed.
There is a second caveat with traceroute that you should be aware of: Traceroute shows you the path from the source to the destination, but this does not mean that the reverse is true. In fact, there is no current way to identify the path from the destination to the source without running a second traceroute from the destination. Keep this in mind when troubleshooting path issues.
Netstat
Netstat is an indispensable tool that shows you all of the network connections on an endpoint. That is, by invoking netstat on your local machine, all of the open ports and connections are shown. This output includes connections that are not completely established as well as connections that are being torn down:
$ sudo netstat -anptu Active Internet connections (servers and established) Proto Recv-Q Send-Q Local Address Foreign Address State PID/Program name tcp 0 0 0.0.0.0:25 0.0.0.0:* LISTEN 4417/master tcp 0 0 0.0.0.0:443 0.0.0.0:* LISTEN 2625/java tcp 0 0 192.168.1.38:389 0.0.0.0:* LISTEN 559/slapd tcp 0 0 0.0.0.0:22 0.0.0.0:* LISTEN 1180/sshd tcp 0 0 192.168.1.38:37190 192.168.1.38:389 ESTABLISHED 2625/java tcp 0 0 192.168.1.38:389 192.168.1.38:45490 ESTABLISHED 559/slapdThe output above shows several different ports in a listening state as well as a few established connections. For listening ports, if the source address is 0.0.0.0, it is listening on all available interfaces. If there is an IP address instead, then the port is open only on that specific interface.
The established connections show the source and destination IPs as well as the source and destination ports. The Recv-Q and Send-Q fields show the number of bytes pending acknowledgment in either direction. Finally, the PID/Program name field shows the process ID and the name of the process responsible for the listening port or connection.
Netstat also has a number of switches that can be used to view other information, such as the routing table or interface statistics. Both IPv4 and IPv6 are supported: There are switches to limit to either version, but both are displayed by default.
In recent years, netstat has been superseded by the ss command. You can find more information on the ss command in this article by Ken Hess.
Conclusion
As you can see, these tools are invaluable when troubleshooting network issues. As a network or systems administrator, I highly recommend becoming intimately familiar with these tools. Having them available might save you a lot of time troubleshooting later.
[ Want more on networking topics? Check out the Linux networking cheat sheet. ]