Linux application profiling
Well, in order to collect this type of information about your process, you don’t actually need a profiler on Linux.
- You can use top in batch mode. It runs in the batch mode either until it is killed or until N iterations is done:
$ top -b -p `pidof a.out` top - 10:31:50 up 12 days, 19:08, 5 users, load average: 0.02, 0.01, 0.02 Tasks: 1 total, 0 running, 1 sleeping, 0 stopped, 0 zombie Cpu(s): 0.0%us, 0.0%sy, 0.0%ni,100.0%id, 0.0%wa, 0.0%hi, 0.0%si, 0.0%st Mem: 16330584k total, 2335024k used, 13995560k free, 241348k buffers Swap: 4194296k total, 0k used, 4194296k free, 1631880k cached PID USER PR NI VIRT RES SHR S %CPU %MEM TIME+ COMMAND 24402 SK 20 0 98.7m 1056 860 S 43.9 0.0 0:11.87 a.out top - 10:31:53 up 12 days, 19:08, 5 users, load average: 0.02, 0.01, 0.02 Tasks: 1 total, 0 running, 1 sleeping, 0 stopped, 0 zombie Cpu(s): 0.9%us, 3.7%sy, 0.0%ni, 95.5%id, 0.0%wa, 0.0%hi, 0.0%si, 0.0%st Mem: 16330584k total, 2335148k used, 13995436k free, 241348k buffers Swap: 4194296k total, 0k used, 4194296k free, 1631880k cached PID USER PR NI VIRT RES SHR S %CPU %MEM TIME+ COMMAND 24402 SK 20 0 98.7m 1072 860 S 19.0 0.0 0:12.44 a.out ps --format pid,pcpu,cputime,etime,size,vsz,cmd -p `pidof a.out` - To record performance data:
perf record -p `pidof a.out` sleep 10 perf record -g -p `pidof a.out` perf report --stdio perf report --stdio --sort=dso -g none perf report --stdio -g none perf report --stdio -g On RHEL 6.3 it is allowed to read /boot/System.map-2.6.32-279.el6.x86_64, so I usually add —kallsyms=/boot/System.map-2.6.32-279.el6.x86_64 when doing a performance report:
perf report --stdio -g --kallsyms=/boot/System.map-2.6.32-279.el6.x86_64 Here I wrote some more information on using Linux `perf`: First of all — this is tutorial about Linux profiling with perf You can use perf if your Linux Kernel is greater than 2.6.32 or OProfile if it is older. Both programs don’t require from you to instrument your program (like Gprof requires). However, in order to get call graph correctly in perf you need to build you program with -fno-omit-frame-pointer . For example: g++ -fno-omit-frame-pointer -O2 main.cpp . You can see a «live» analysis of your application with perf top:
sudo perf top -p `pidof a.out` -K Or you can record performance data of a running application and analyze them after that:
- To record performance data:
perf record -p `pidof a.out` sleep 10 perf record -g -p `pidof a.out` perf report --stdio perf report --stdio --sort=dso -g none perf report --stdio -g none perf report --stdio -g Or you can record performance data of an application and analyze them after that just by launching the application in this way and waiting for it to exit:
This is an example of profiling a test program.
The test program is in file main.cpp (main.cpp is at the bottom of the answer):
g++ -m64 -fno-omit-frame-pointer -g main.cpp -L. -ltcmalloc_minimal -o my_test I use libmalloc_minimial.so since it is compiled with -fno-omit-frame-pointer while libc malloc seems to be compiled without this option. Then I run my test program:
Then I record performance data of a running process:
perf record -g -p `pidof my_test` -o ./my_test.perf.data sleep 30 Then I analyze the load per module:
perf report --stdio -g none --sort comm,dso -i ./my_test.perf.data # Overhead Command Shared Object # . . . # 70.06% my_test my_test 28.33% my_test libtcmalloc_minimal.so.0.1.0 1.61% my_test [kernel.kallsyms] Then load per function is analyzed:
perf report --stdio -g none -i ./my_test.perf.data | c++filt # Overhead Command Shared Object Symbol # . . . . # 29.30% my_test my_test [.] f2(long) 29.14% my_test my_test [.] f1(long) 15.17% my_test libtcmalloc_minimal.so.0.1.0 [.] operator new(unsigned long) 13.16% my_test libtcmalloc_minimal.so.0.1.0 [.] operator delete(void*) 9.44% my_test my_test [.] process_request(long) 1.01% my_test my_test [.] operator delete(void*)@plt 0.97% my_test my_test [.] operator new(unsigned long)@plt 0.20% my_test my_test [.] main 0.19% my_test [kernel.kallsyms] [k] apic_timer_interrupt 0.16% my_test [kernel.kallsyms] [k] _spin_lock 0.13% my_test [kernel.kallsyms] [k] native_write_msr_safe and so on . Then call chains are analyzed:
perf report --stdio -g graph -i ./my_test.perf.data | c++filt # Overhead Command Shared Object Symbol # . . . . # 29.30% my_test my_test [.] f2(long) | --- f2(long) | --29.01%-- process_request(long) main __libc_start_main 29.14% my_test my_test [.] f1(long) | --- f1(long) | |--15.05%-- process_request(long) | main | __libc_start_main | --13.79%-- f2(long) process_request(long) main __libc_start_main 15.17% my_test libtcmalloc_minimal.so.0.1.0 [.] operator new(unsigned long) | --- operator new(unsigned long) | |--11.44%-- f1(long) | | | |--5.75%-- process_request(long) | | main | | __libc_start_main | | | --5.69%-- f2(long) | process_request(long) | main | __libc_start_main | --3.01%-- process_request(long) main __libc_start_main 13.16% my_test libtcmalloc_minimal.so.0.1.0 [.] operator delete(void*) | --- operator delete(void*) | |--9.13%-- f1(long) | | | |--4.63%-- f2(long) | | process_request(long) | | main | | __libc_start_main | | | --4.51%-- process_request(long) | main | __libc_start_main | |--3.05%-- process_request(long) | main | __libc_start_main | --0.80%-- f2(long) process_request(long) main __libc_start_main 9.44% my_test my_test [.] process_request(long) | --- process_request(long) | --9.39%-- main __libc_start_main 1.01% my_test my_test [.] operator delete(void*)@plt | --- operator delete(void*)@plt 0.97% my_test my_test [.] operator new(unsigned long)@plt | --- operator new(unsigned long)@plt 0.20% my_test my_test [.] main 0.19% my_test [kernel.kallsyms] [k] apic_timer_interrupt 0.16% my_test [kernel.kallsyms] [k] _spin_lock and so on . So at this point you know where your program spends time.
And this is the main.cpp file for the test:
#include #include #include time_t f1(time_t time_value) < for (int j = 0; j < 10; ++j) < ++time_value; if (j%5 == 0) < double *p = new double; delete p; >> return time_value; > time_t f2(time_t time_value) < for (int j = 0; j < 40; ++j) < ++time_value; >time_value = f1(time_value); return time_value; > time_t process_request(time_t time_value) < for (int j = 0; j < 10; ++j) < int *p = new int; delete p; for (int m = 0; m < 10; ++m) < ++time_value; >> for (int i = 0; i < 10; ++i) < time_value = f1(time_value); time_value = f2(time_value); >return time_value; > int main(int argc, char* argv2[]) < int number_loops = argc >1 ? atoi(argv2[1]) : 1; time_t time_value = time(0); printf("number loops %d\n", number_loops); printf("time_value: %d\n", time_value); for (int i = 0; i < number_loops; ++i) < time_value = process_request(time_value); >printf("time_value: %ld\n", time_value); return 0; > Profiling applications in linux
Profiling is an alternative to benchmarking that is often more effective, as it gives you more fine grained measurements for the components of the system you’re measuring, thus minimising external influences from consideration. It also gives the relative cost of various components, further discounting external influence.
As a consequence of giving more fine grained information for a component, profiling is really just a special case of monitoring and often uses the same infrastructure. As systems become more complex, it’s becoming increasingly important to know what monitoring tools are available. By the way, being able to drill down into software components as I’ll describe below, is a large advantage that open systems have over closed ones.
GNU/Linux profiling and monitoring tools are currently progressing rapidly, and are in some flux, but I’ll summarise the readily available utils below.
System wide profiling
The Linux kernel has recently implemented a very useful perf infrastructure for profiling various CPU and software events. To get the perf command, install linux-tools-common on ubuntu, linux-base on debian, perf-utils on archlinux, or perf on fedora. Then you can profile the system like:
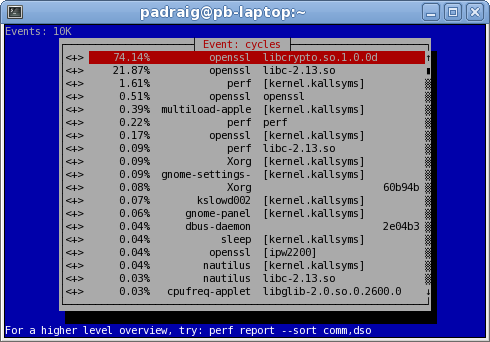
$ perf record -a -g sleep 10 # record system for 10s $ perf report --sort comm,dso # display report
That will display this handy curses interface on basically any hardware platform, which you can use to drill down to the area of interest.
See Brendan Gregg’s perf examples for a more up to date and detailed exploration of perf’s capabilities.
Other system wide profiling tools to consider are sysprof and oprofile.
It’s worth noting that profiling can be problematic on x86_64 at least, due to -fno-omit-frame-pointer being removed to increase performance, and 32 bit fedora at least may be going the same way.
Application level profiling
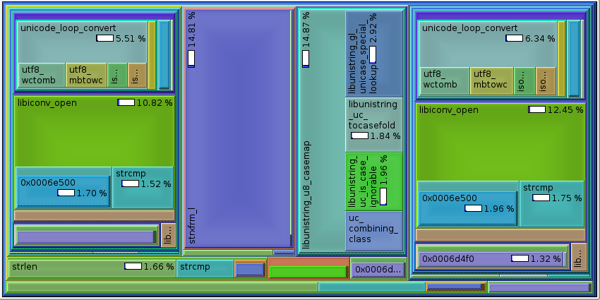
One can use perf to profile a particular command too, with a variant of the above, like perf record -g $command , or the common pattern of command >/dev/null & perf top -p $! , or see Ingo Molnar’s example of using perf to analyze the string comparison bottleneck in `git gc`. There are other useful userspace tools available though. Here is an example profiling ulc_casecoll, where the graphical profile below is generated using the following commands.
valgrind --tool=callgrind ./a.out kcachegrind callgrind.out.*
Note kcachegrind is part of the «kdesdk» package on my fedora system, and can be used to read oprofile data (mentioned above) or profile python code too.
Profiling hardware events
I’ve detailed previously how important, efficient use of the memory hierarchy is for performance. Newer CPUs are providing counters to help tune your use of this hierarchy, and the previously mentioned Linux perf tools, expose this well. Unfortunately my pentium-m laptop doesn’t expose any cache counters, but the following example from Ingo Molnar, shows how useful this technique can be.
static char array[1000][1000]; int main (void)
$ perf stat --repeat 10 -e cycles:u -e instructions:u -e l1-dcache-loads:u \ -e l1-dcache-load-misses:u ./a.out Performance counter stats for './a.out' (10 runs): 6,719,130 cycles:u ( +- 0.662% ) 5,084,792 instructions:u # 0.757 IPC ( +- 0.000% ) 1,037,032 l1-dcache-loads:u ( +- 0.009% ) 1,003,604 l1-dcache-load-misses:u ( +- 0.003% ) 0.003802098 seconds time elapsed ( +- 13.395% )
Note the large ratio of cache misses.
Now if we change array[j][i]++; to array[i][j]++; and re-run perf-stat:
$ perf stat --repeat 10 -e cycles:u -e instructions:u -e l1-dcache-loads:u \ -e l1-dcache-load-misses:u ./a.out Performance counter stats for './a.out' (10 runs): 2,395,407 cycles:u ( +- 0.365% ) 5,084,788 instructions:u # 2.123 IPC ( +- 0.000% ) 1,035,731 l1-dcache-loads:u ( +- 0.006% ) 3,955 l1-dcache-load-misses:u ( +- 4.872% ) 0.001806438 seconds time elapsed ( +- 3.831% )
$ perf top -e l1-dcache-load-misses -e l1-dcache-loads PerfTop: 1923 irqs/sec kernel: 0.0% exact: 0.0% [l1-dcache-load-misses. ---------------------------------------------------------------------------------- weight samples pcnt funct DSO ______ _______ _____ _____ ______________________ 1.9 6184 98.8% func2 /home/padraig/a.out 0.0 69 1.1% func1 /home/padraig/a.out