Qt creator debugger linux

Setting Up Debugger

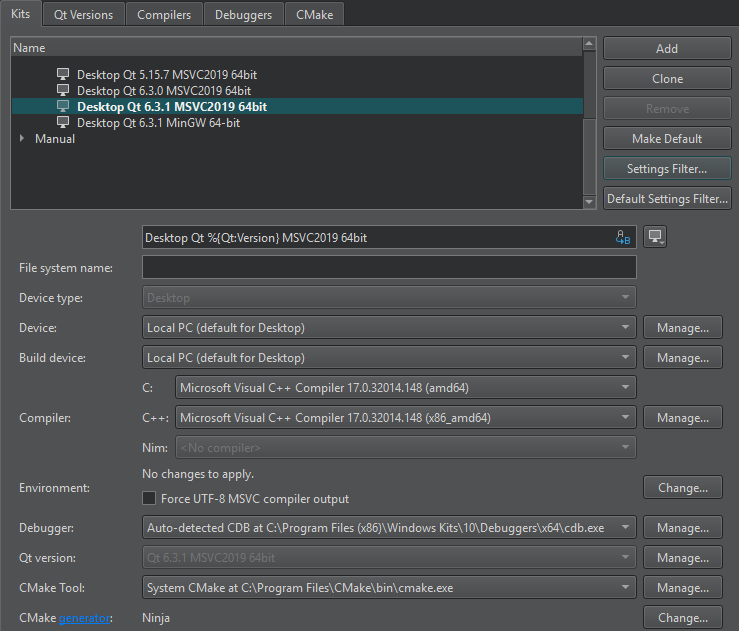
The main debugger preferences are associated with the kit you build and run your project with. To specify the debugger and compiler to use for each kit, select Edit > Preferences > Kits. <Kits preferences data-lazy-src=

Qt Creator supports native debuggers for debugging compiled code. On most supported platforms, you can use the GNU Symbolic Debugger (GDB). On Microsoft Windows, when using the Microsoft tool chain, you need the Microsoft Console Debugger (CDB). On macOS and Linux, you can use the LLDB debugger. On all supported platforms, you can use PDB to debug Python source code.

Platform Compiler Native Debugger
Linux GCC, ICC GDB, LLDB
Unix GCC, ICC GDB
macOS GCC, Clang LLDB, FSF GDB (experimental)
Windows/MinGW GCC GDB
Windows/MSVC Microsoft Visual C++ Compiler Debugging Tools for Windows/CDB

Supported GDB Versions

Use GDB 7.5, or later, with the Python scripting extension and Python version 3.3, or later. For remote debugging using GDB and GDB server, the minimum supported version of GDB server on the target device is 7.0.

Supported CDB Versions

Supported LLDB Versions

The LLDB native debugger has similar functionality to the GDB debugger. LLDB is the default debugger in Xcode on macOS for C++ on the desktop. LLDB is typically used with the Clang compiler (even though you can use it with GCC, too). On macOS you can use the LLDB version delivered with Xcode or build from source. The minimum supported version is LLDB 320.4. You need a LLDB version built with Python support. On Linux, the minimum supported version is LLDB 3.8.

Читайте также:  Linux для хакеров 2019

Installing Native Debuggers

GDB

On Windows, use the Python-enabled GDB version that is bundled with the Qt package or comes with recent versions of MinGW. On most Linux distributions, the GDB builds shipped with the system are sufficient. You can also build your own GDB, as instructed in Building GDB. Builds of GDB shipped with Xcode on macOS are no longer supported.

Debugging Tools for Windows

To use the CDB debugger, install the Debugging Tools for Windows when you install Qt Creator either by using the Qt Online Installer (in Qt > Tools > Qt Creator) or by using the stand-alone Qt Creator installation packages. The 32-bit CDB version can only debug 32-bit executables, whereas the 64-bit version can debug both 64-bit and 32-bit executables. However, interrupting a 32-bit executable with a 64-bit debugger can result in a stack trace of the WOW64 emulator 32-bit emulation layer being displayed. Qt Creator extends the command line debugger by loading the qtcreatorcdbext.dll extension library into it. The library must be available in the libs\qtcreatorcdbext64 and libs\qtcreatorcdbext32 folder. To install it there, select Qt Creator CDB Debugger Support when you install Qt Creator. When manually building Qt Creator using the Microsoft Visual C++ Compiler, the build process checks for the required files in «%ProgramFiles%\Debugging Tools for Windows» .

Debugging Tools for macOS

The Qt binary distribution has both debug and release variants of the libraries. However, you have to explicitly tell the runtime linker that you want to use the debug libraries even if your application is compiled as debug, as release is the default library. If you use a qmake based project in Qt Creator, you can set a flag in your run configuration, in Projects mode. In the run configuration, select Use debug version of frameworks. For more detailed information about debugging on macOS, see: Mac OS X Debugging Magic.

LLDB

PDB

<Run settings for a Python project data-lazy-src=

© 2023 The Qt Company Ltd. Documentation contributions included herein are the copyrights of their respective owners. The documentation provided herein is licensed under the terms of the GNU Free Documentation License version 1.3 as published by the Free Software Foundation. Qt and respective logos are trademarks of The Qt Company Ltd in Finland and/or other countries worldwide. All other trademarks are property of their respective owners.

Источник

Debugging

The Qt Creator debugger plugin acts as an interface between the Qt Creator core and external native debuggers that you can use to:

  • Debug executable binary files — GNU Symbolic Debugger (GDB), the Microsoft Console Debugger (CDB), and the debugger of the low level virtual machine (LLVM) project, LLDB.
  • Debug QML and Java code and Qt Quick applications — QML/JavaScript debugger.
  • Debug Python source code — PDB.

The following sections describe how to set up, launch, and interact with the debugger:

  • Setting Up Debugger The debugger plugin automatically selects a suitable native debugger for each kit from the ones found on your system. You can edit the kits to override this choice.
  • Launching the Debugger To start an application from an open project under the control of a debugger, select the (Start Debugging of Startup Project) button or press F5. Other, less common start options are available in the Debug >Start Debugging menu.
  • Debug Mode Views Use the views in the Debug mode to inspect the state of your application while debugging.
  • Stopping Applications You can interrupt a running application before it terminates or to find out why the application does not work correctly. Set breakpoints to stop the application for examining and changing variables, setting new breakpoints or removing old ones, and then continue running the application.
  • Examining Data You can examine variable values and data structures in detail.
  • Remote Debugging You can debug an application that runs on a remote target with the necessary helper processes also running.
  • Debugger Preferences Specify preferences for managing debugger processes. You can specify preferences that are common to all debuggers, or the native debugger that you use, GDB or CDB.
  • Using Debugging Helpers Qt Creator is able to show complex data types in a customized, user-extensible manner. For this purpose, it takes advantage of two technologies, collectively referred to as debugging helpers.
  • Debugging Qt Quick Projects When debugging a Qt Quick application, you can inspect the state of the application while debugging JavaScript functions. You can set breakpoints, view call stack trace, and examine locals and expressions. While the application is running, you can inspect QML objects and user interfaces, as well as execute JavaScript expressions.
  • Debugging a C++ Example Application Illustrates how to debug C++ applications in Qt Creator.
  • Debugging a Qt Quick Example Application Illustrates how to debug Qt Quick applications in Qt Creator.
  • Troubleshooting Debugger If you encounter problems while debugging, check for possible solutions to them.

© 2023 The Qt Company Ltd. Documentation contributions included herein are the copyrights of their respective owners. The documentation provided herein is licensed under the terms of the GNU Free Documentation License version 1.3 as published by the Free Software Foundation. Qt and respective logos are trademarks of The Qt Company Ltd in Finland and/or other countries worldwide. All other trademarks are property of their respective owners.

Источник

Debug Mode Views

<Debug mode views while debugging data-lazy-src=

The log view acts as a console, so you can send the contents of the line under the text cursor in the log directly to the native debugger.

Note: The Views menu shows some views only while you are debugging.

Managing Debug Views

When you are not debugging, the Debug mode shows the Debugger Preset perspective:

<Initial Debug mode views data-lazy-src=

Читайте также:  Чем открыть скрипт linux
Оцените статью
Adblock
detector