- Use Glances to Monitor Remote Linux in Web Server Mode
- Run Glances in Web Server Mode as a Service
- Glances — A Versatile System Monitoring Tool for Linux Systems
- Features of Glances
- Installing Glances on Ubuntu and other Linux distributions
- Using Glances to monitor Linux system resources on local system (standalone mode)
- Using Glances to monitor remote Linux systems (Client – Server mode)
- Monitor Linux system resources in web browser using Glances (Web Mode)
- Export Glances data to different services
- Use REST API to integrate Glances with other services
- Closing thoughts on Glances
Use Glances to Monitor Remote Linux in Web Server Mode
Glances is a free open source, modern, cross-platform, real-time top and htop like system monitoring tool. It offers advanced features compared to its counterparts, and can run in different modes: as a standalone, in client/server mode and in web server mode.
Considering the web server mode, you do not necessarily need to log into your remote server via SSH to run glances, you can run it in web server mode and access it via a web browser to remotely monitor your Linux server, as explained below.
To run glances in web server mode, you need to install it together with the Python bottle module, a fast, simple and lightweight WSGI micro web-framework, using the appropriate command for your Linux distribution.
$ sudo apt install glances python-bottle #Debian/Ubuntu $ sudo yum install glances python-bottle #RHEL/CentOS $ sudo dnf install glancespython-bottle #Fedora 22+
Alternatively, install it using PIP command like shown.
Once you have installed the above packages, launch glances with the -w flag to run it in web server mode. By default, it will listen on port 61208.
If you are running firewalld services, then you should open port 61208 to allow inbound traffic to that port.
$ sudo firewall-cmd --permanent --add-port=61208/tcp $ sudo firewall-cmd --reload
For UFW firewall, run these commands.
$ sudo ufw allow 61208/tcp $ sudo ufw reload
After that, from a web browser, use the URL http://SERVER_IP:61208/ to access the glances UI.
If you are using systemd system and services manager, you can run glances in web server mode as a service for efficient management, as explained in the next section. I actually prefer this method to running it as a background process.
Run Glances in Web Server Mode as a Service
Start by creating your service unit file (which I have preferred to name as glancesweb.service) under /usr/lib/systemd/system/glancesweb.service.
$ sudo vim /usr/lib/systemd/system/glancesweb.service
Then copy and paste the unit file configuration below in it.
[Unit] Description = Glances in Web Server Mode After = network.target [Service] ExecStart = /usr/bin/glances -w -t 5 [Install] WantedBy = multi-user.target
The above configuration tells systemd that this is a unit of type service, it should be loaded after the network.target.
And once the system is in the network target, systemd will invoke the command “/usr/bin/glances -w -t 5” as a service. The -t specifies an interval for live updates in seconds.
The [install] section informs systemd that this service is wanted by “multi-user.target”. Therefore, when you enable it, a symbolic link is created from the /etc/systemd/system/multi-user.target.wants/glancesweb.service to /usr/lib/systemd/system/glancesweb.service. Disabling it will delete this symbolic link.
Next, enable your new systemd service, start and view its status as follows.
$ sudo systemctl enable connection.service $ sudo systemctl start connection.service $ sudo systemctl status connection.service
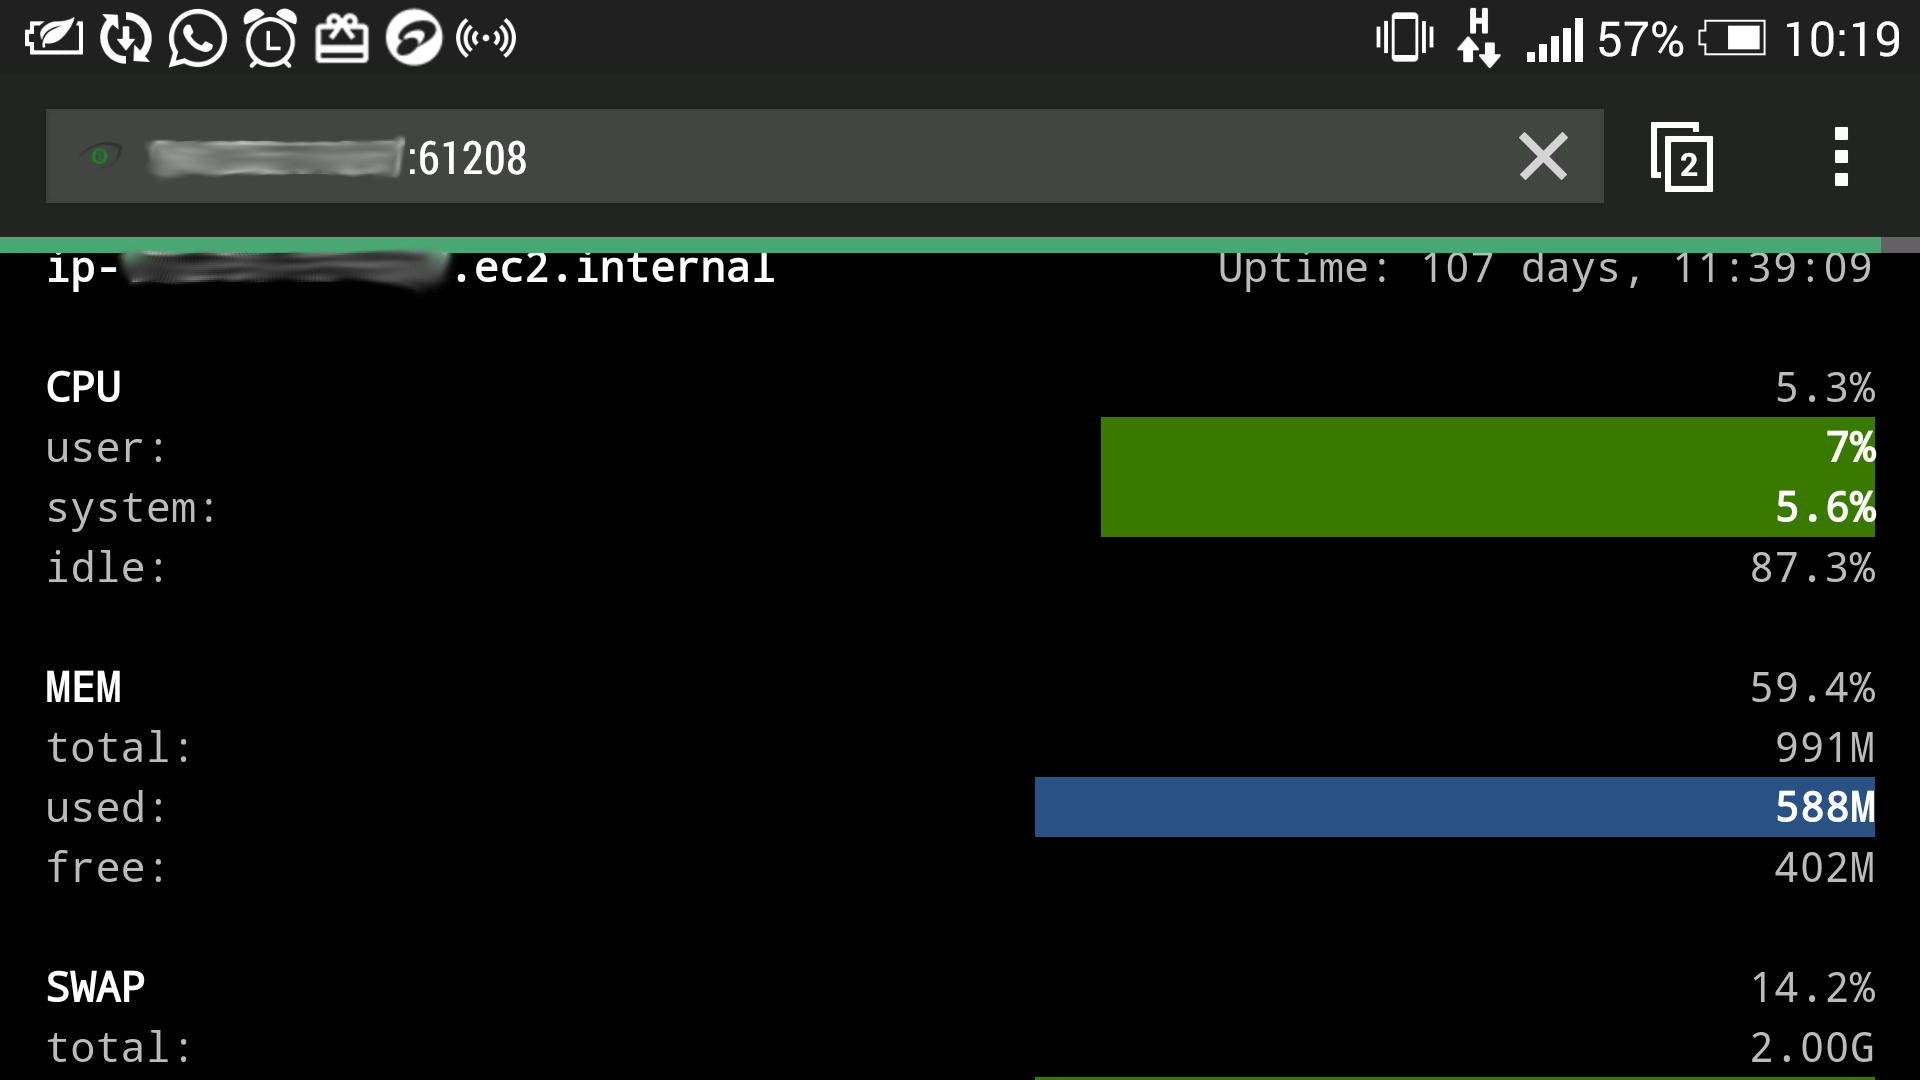
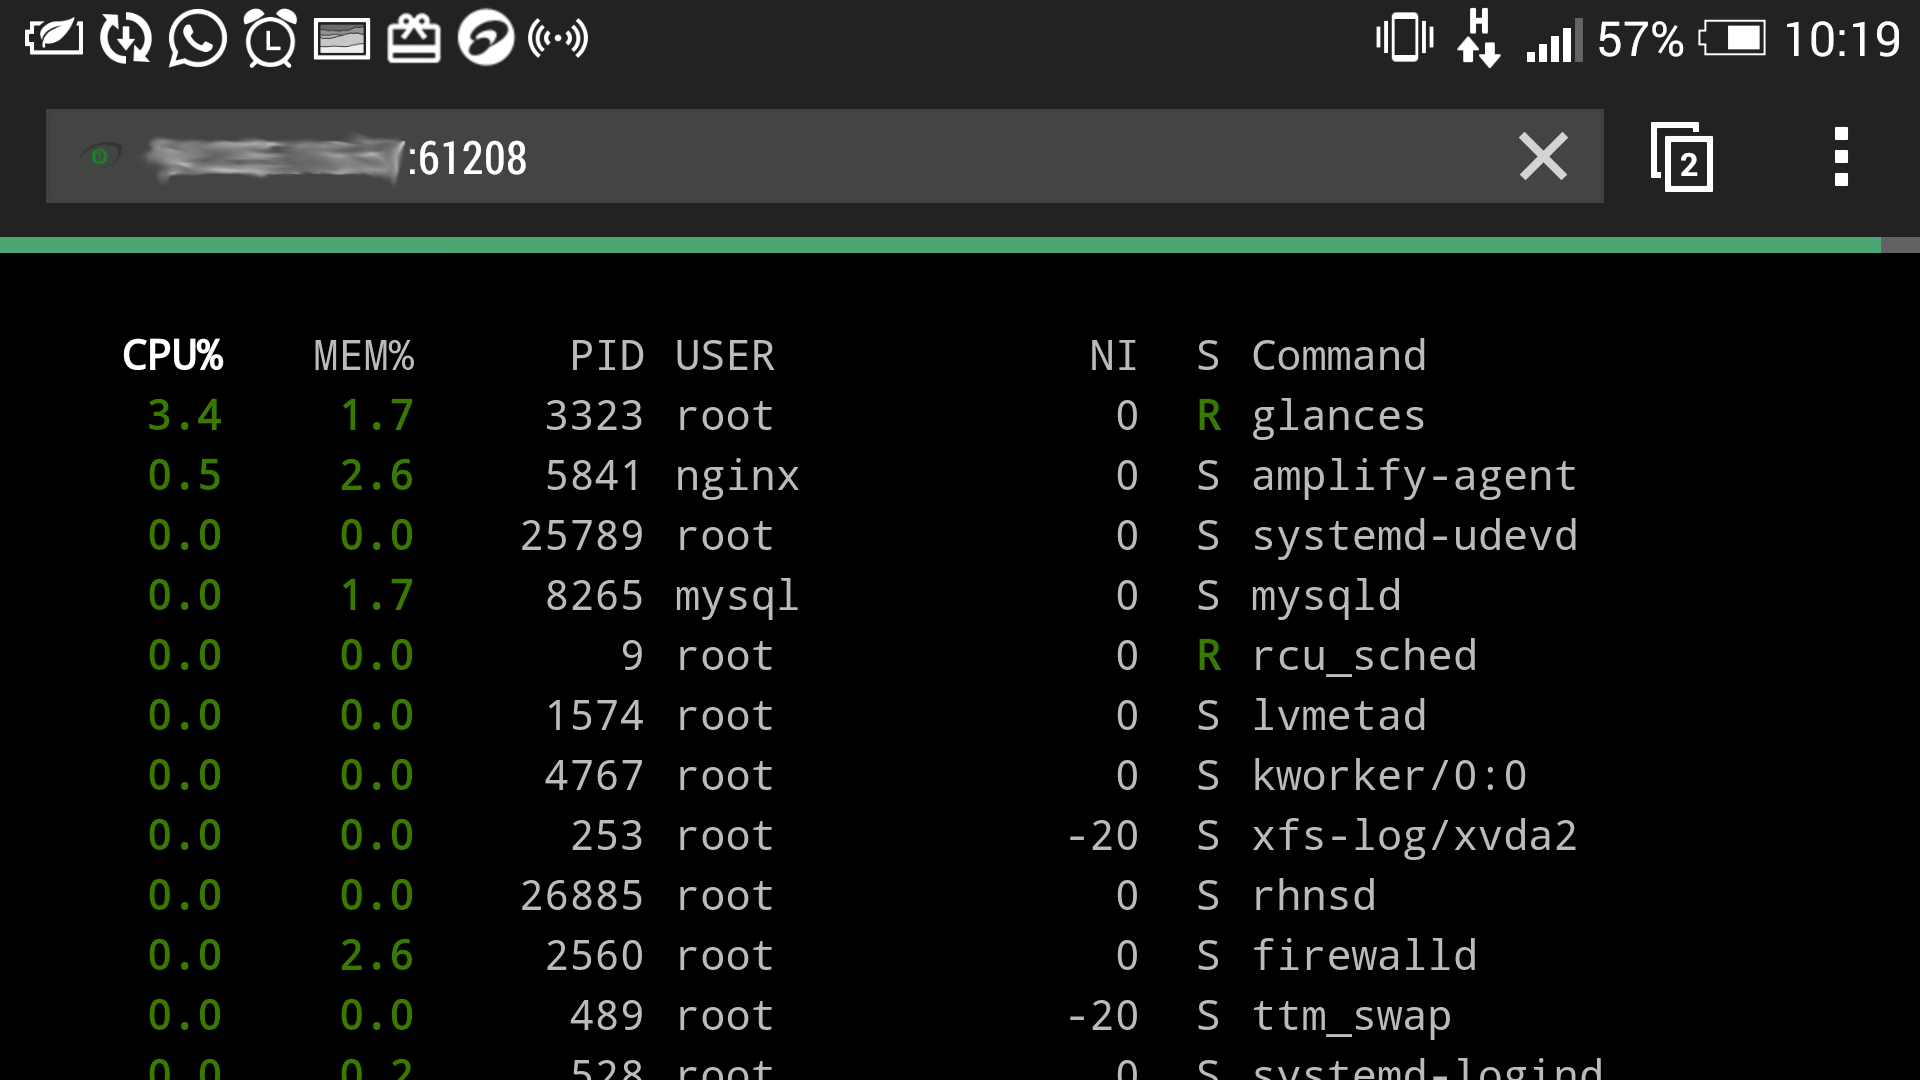
Finally, from your web browser, use the URL http://SERVER_IP:61208/ to remotely monitor your Linux servers via the glances UI, on any device (smart phone, tablet or computer).
You can change the refresh rate of the page, simply add the period in seconds at the end of the URL, this sets the refresh rate to 8 seconds.
One downside of running glances in web server mode is that, if the Internet connection is poor the client tends to easily disconnect from the server.
You can learn how to create new systemd services from this guide:
That’s all! If you have any questions or additional information to add, use the comment from below.
Glances — A Versatile System Monitoring Tool for Linux Systems
The most commonly used command line tools for process monitoring on Linux are top and its colorful, feature rich cousin htop .
To monitor temperature on Linux, you can use lm-sensors. Similarly, there are many utilities to monitor other real-time metrics such as Disk I/O, Network Stats and others.
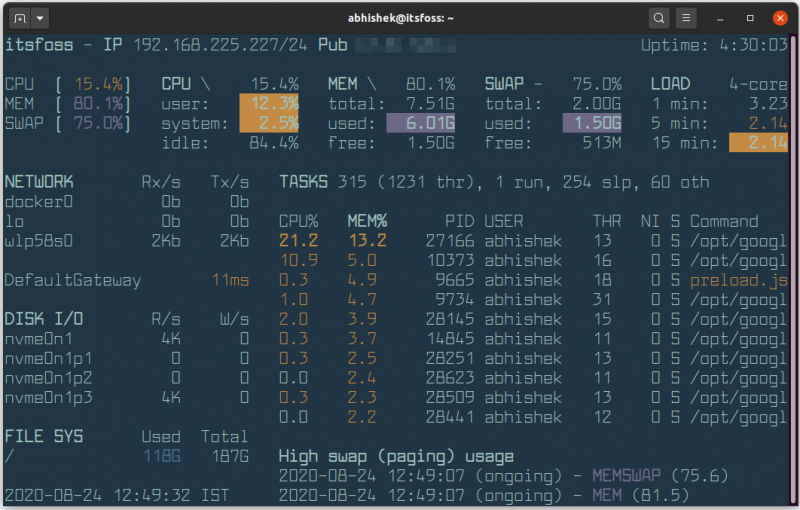
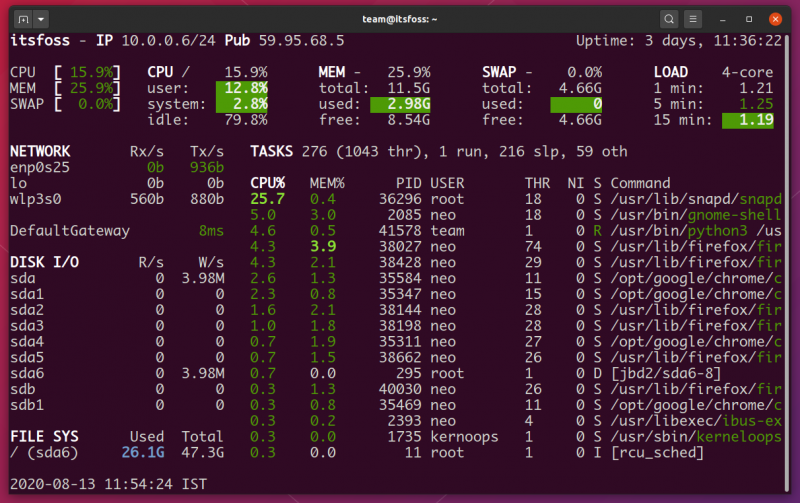
Glances is a system monitoring tool which ties them all together and offers a lot more features. What I like the most is that you can use run Glances on a remote Linux server and monitor the system resources on your local system or monitor it through your web browser.
Here’s what it looks like. The terminal in the below screenshot has been beautified with Pywal tool that automatically changes the color based on wallpaper.
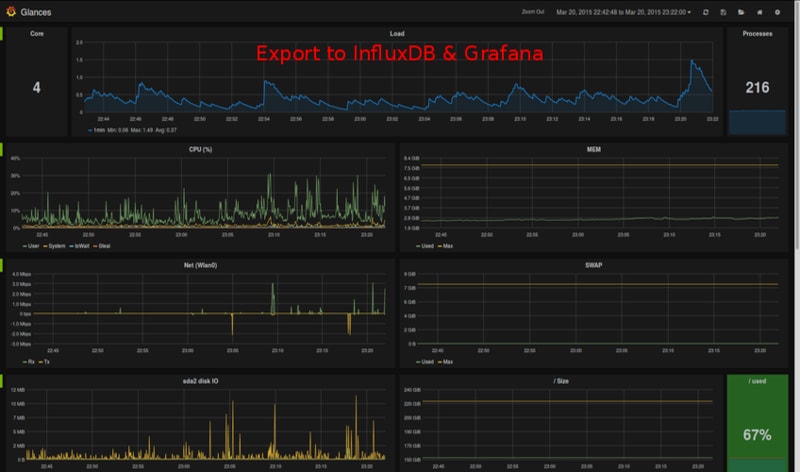
You can also integrate it to a tool like Grafana to monitor the stats in an intuitive dashboard.
It is written in Python which means that it can be used on most platforms with almost all features.
Features of Glances
Let’s have a quick glance over the main feature Glances provides (pun intended).
- Can monitor 15+ metrics on a system (including docker containers).
- Flexible usage modes: standalone, client-server, over SSH and web mode.
- Versatile REST API and XML-RPC available for integrations.
- Readily supports exporting data to different services and databases.
- Highly configurable and adaptable to different needs.
- Very comprehensive Documentation.
Installing Glances on Ubuntu and other Linux distributions
Glances is available in the official repositories of many Linux distributions. This means you can use your distribution’s package manager to install it easily.
On Debian/Ubuntu based distributions, you can use the following command:
You can also install the latest Glances using snap package:
sudo snap install glances Since Glances is based on Python, you can also use PIP to install it on most Linux distributions. Install PIP first and then use it to install Glances:
sudo pip3 install glancesIf nothing else, you can always use the auto install script provided by Glances developer. Though we at It’s FOSS don’t recommend running random scripts directly on your system. It’s entirely your decision.
curl -L https://bit.ly/glances | /bin/bashYou can check out other ways to install Glances from their documentation, you can also install it as a docker container.
Using Glances to monitor Linux system resources on local system (standalone mode)
You can easily launch Glances to monitor your local machine by running this command n the terminal.
You can instantly observe that it integrates a lot of different information in one single screen. I like that it shows the public and private IP’s of the computer right at the top.
Glances is also interactive, meaning you can use commands to interact with it while it is running. You can press “s” to bring up the sensors onto the screen; “k” to bring up the TCP connections list; “1” to expand the CPU stats to show individual threads.
You can also use the arrow keys to move around the list of processes and sort the table by different metrics.
You can launch Glances with various command line options. There are plenty more interactive commands as well. You can find the complete list in their comprehensive documentation.
Press Ctrl+C to exit Glances.
Using Glances to monitor remote Linux systems (Client – Server mode)
To monitor a remote computer you can use Glances in client-server mode. You need to have Glances installed on both systems.
On the remote Linux system, you’ll have to launch glances in server mode using the -s option.
On the client system, use this command to launch Glances in client mode and connect to the server.
glances -c server_ip_addressYou can also SSH into any computer and launch Glances, which works flawlessly. More information about client-server mode here.
Monitor Linux system resources in web browser using Glances (Web Mode)
Glances can also run in web mode. This means that you can use a web browser to access Glances. Unlike the previous client-server mode, you don’t need to install Glances on the client system.
To start Glances in web mode, use the -w option.
Keep in mind that it may display “Glances Web User Interface started on http://0.0.0.0:61208” even on a Linux server when it is actually using the server’s IP address.
The main part is that it uses 61208 port number and you can use it to access Glances via web browser. Just type the server’s IP address followed by the port number like http://123.123.123.123:61208.
You can also use it on the local system using http://0.0.0.0:61208/ or https://localhost:61208/.
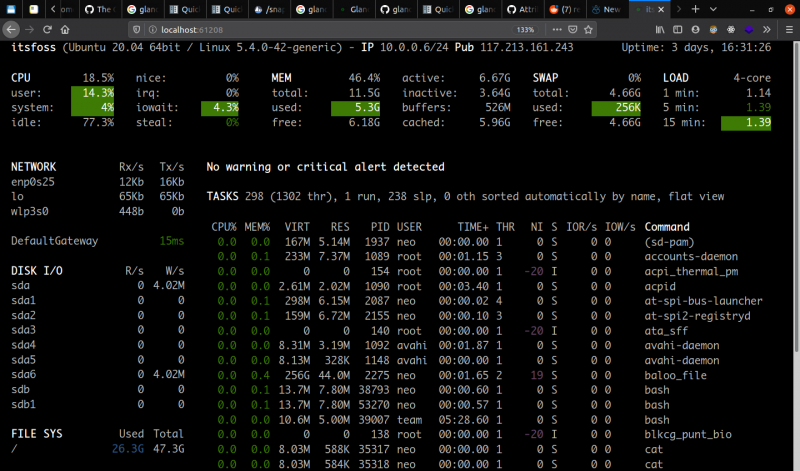
The web mode also emulates the terminal look. The web version is built with responsive design principles in mind and looks good even on phones.
You may want to protect the web mode with a password so that only authorized people could use it. The default username is glances.
[email protected]:~# glances -w --password Define the Glances webserver password (glances username): Password (confirm): Do you want to save the password? [Yes/No]: n Glances Web User Interface started on http://0.0.0.0:61208/You can find more information on configuring password in the quickstart guide.
Export Glances data to different services
One of the biggest advantage of using Glances is the out of the box support to export data to various databases, services and integration into various data pipelines seamlessly.
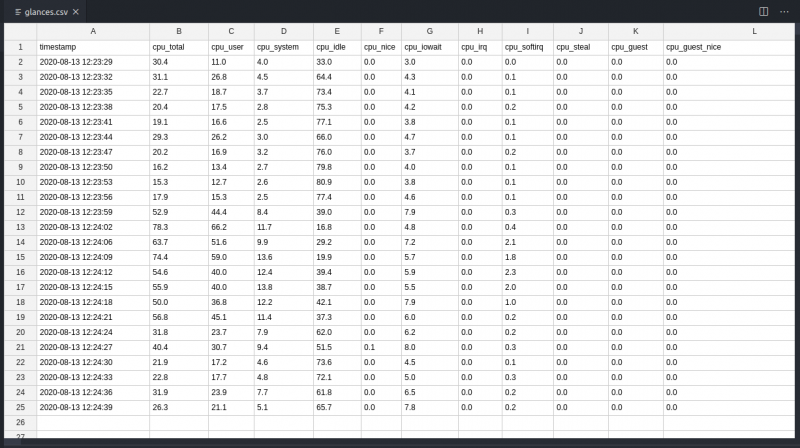
You can export to CSV while monitoring with this command.
glances --export csv --export-csv-file /tmp/glances.csv‘/tmp/glances.csv’ is the location of the file. The data is filled in neatly as time series.
You can export to powerful applications like Prometheus to enable conditional triggers and notifications.
It can directly plug into messaging services like RabbitMQ, MQTT, streaming platforms like Kafka and export time series data to databases like InfluxDB and visualize using Grafana.
You can check out the whole list of services and export options here.
Use REST API to integrate Glances with other services
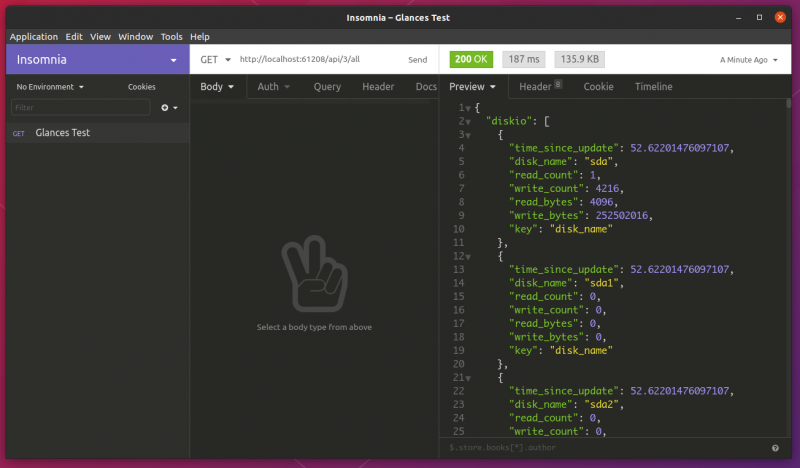
This is my favorite feature in the whole stack. Glances not only brings together various metrics together, it also exposes them via APIs.
This simple yet powerful feature makes it very easy to build custom applications, services and middleware applications for any specific use cases.
REST API server stars automatically when you launch Glances in web mode. To launch it in API server only mode you can use the following command.
The REST API documentation is comprehensive and the responses are easy to integrate with a web application. This makes it easy to build a unified dashboard to monitor multiple servers with a tool like Node-RED.
Glances also provides an XML-RPC server, you can check out the documentation here.
Closing thoughts on Glances
Glances uses the psutil python library to access different system stats. I had built a simple API server using the same library to retrieve CPU usage back in 2017. I was able to monitor all the Raspberry Pi’s in a cluster using a dashboard built with Node-RED.
Glances could have saved me some time while offering way more features, unfortunately I didn’t know about it back then.
I did try to install Glances on my Raspberry Pi’s while writing this article, unfortunately it failed with some errors with all the installation methods. I’ll update the article when I succeed or maybe write another article with steps to install on a Raspberry Pi.
I wish Glances offered a way to kill processes like top or htop. Let’s hope that we get it in upcoming releases.
I hope this gave you a good deal of information on Glances. What system monitoring tools do you guys use? let me know in the comments.