- Generate CPU, Memory and I/O Report using SAR command
- Install SAR on RHEL 8 / RHEL 9
- Install SAR on Ubuntu 22.04 / 20.04
- 1) Generating CPU Report on the Fly 5 times every 2 seconds
- 2) Saving sar command output to a file
- 3) Generating Memory Usage Report
- 4) Generating Paging Statistics Report
- 5) Generating Block Device Statistics Report
- 6) Generating Network Statistic Report
- 7) Reading SAR Log File using -f
- 18 thoughts on “Generate CPU, Memory and I/O Report using SAR command”
- Leave a Comment Cancel reply
- Recent Posts
- Pages
- Sar для мониторинга производительности системы
- Установка Sar
- Использование Sar
Generate CPU, Memory and I/O Report using SAR command
SAR stands for System Activity Report, as its name suggest, sar command is used to collect, report & save CPU, Memory, I/O usage in Unix like operating systems. SAR command generate the reports on the fly and can also save the reports in log files as well.
In this article we will discuss different examples of sar command on RHEL 8/ RHEL 9 & Ubuntu 22.04. In case, sar is not installed on your system then use beneath steps,
Install SAR on RHEL 8 / RHEL 9
$ sudo dnf install sysstat -y
Install SAR on Ubuntu 22.04 / 20.04
$ sudo apt update $ sudo apt install -y sysstat
Start the sadc (system activity data collector) service( sysstat ) so that it saves the reports in log file “/var/log/sa/saDD” where DD represents Current day and already existing files will be archived.
$ systemctl start sysstat $ systemctl enable sysstat
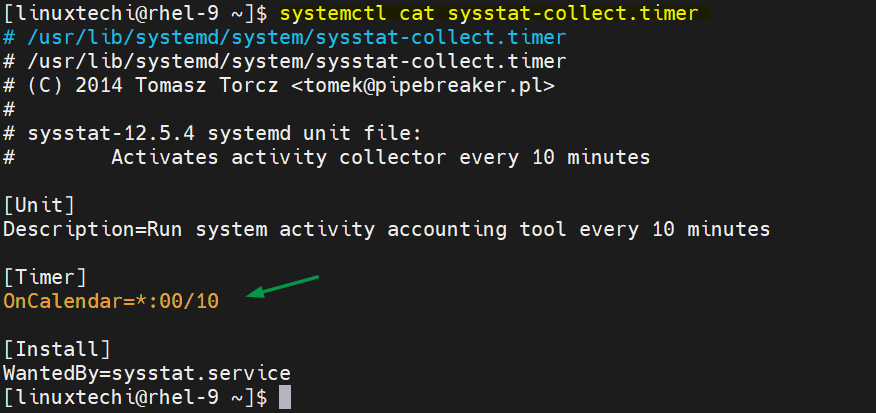
Once the sysstat service started then sar will start collecting the data every 10 minutes and generate its report daily. On RHEL 8/ RHEL 9, following systemd file is responsible for collecting and generating reports.
$ systemctl cat sysstat-collect.timer
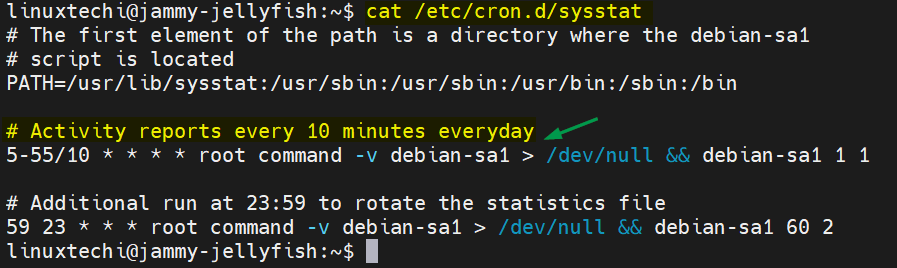
On Ubuntu 22.04/20.04, following cron tab is responsible for generating the report every 10 minutes.
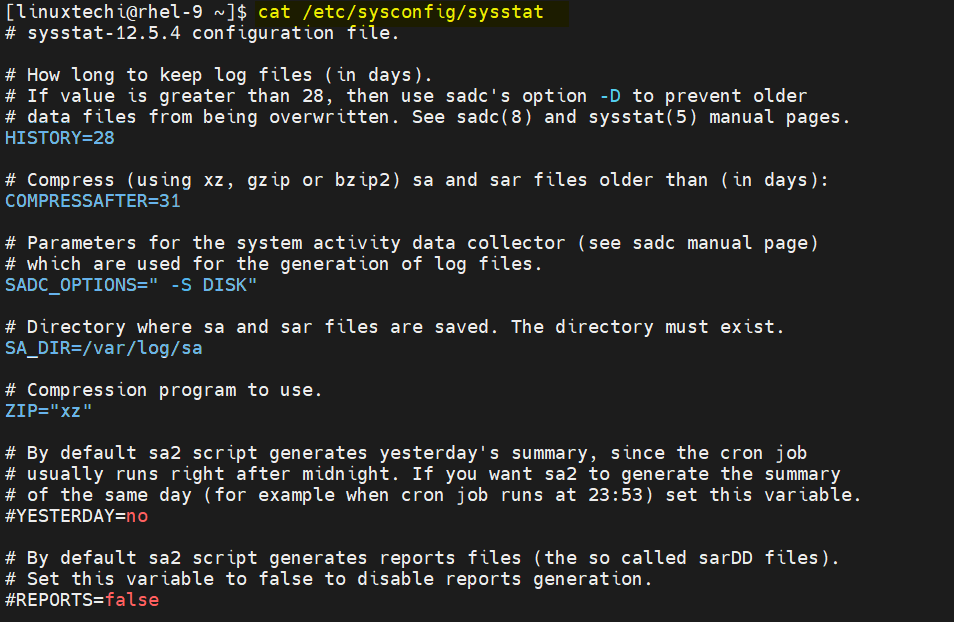
Below is the default config file of sysstat (sar command) on RHEL systems.
Default Configuartion of sysstat on Ubuntu 22.04/20.04
Without any further delay, let’s deep dive into examples of sar command and see how the reports are generated.
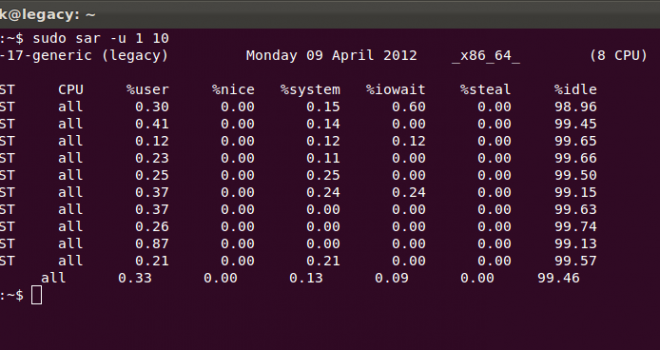
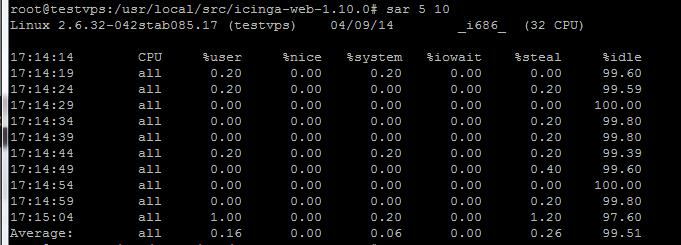
1) Generating CPU Report on the Fly 5 times every 2 seconds
To generate the CPU report 5 times every 2 seconds, run
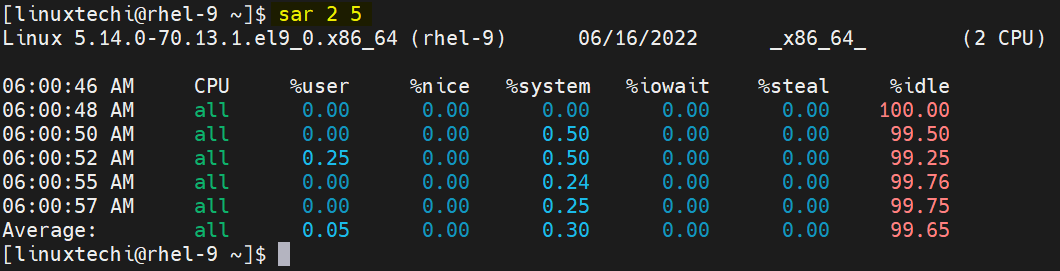
If the %I/O wait is more than zero for a longer period of time then we can consider there is some bottleneck in I/O system (Hard disk or Network )
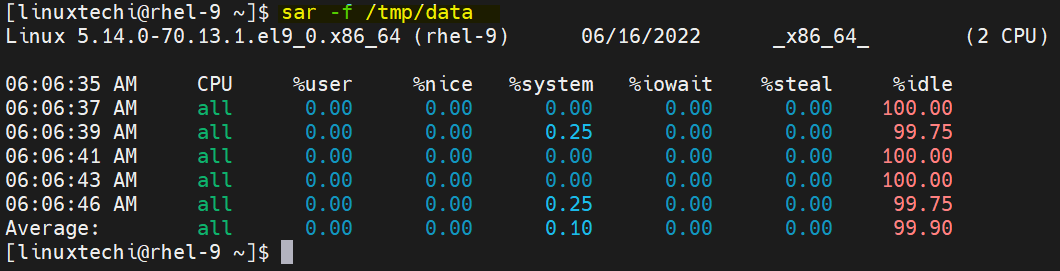
2) Saving sar command output to a file
To save the sar command output to a file, use -o option , example is shown below
$ sar 2 5 -o /tmp/data > /dev/null 2>&1
Now use “ sar -f ” to display the reports.
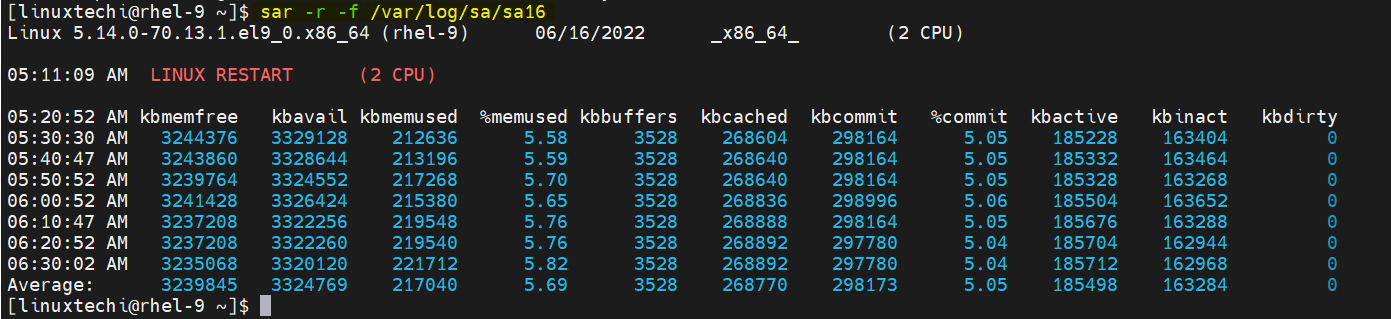
3) Generating Memory Usage Report
-r option in the sar command is used to generate memory usage report.
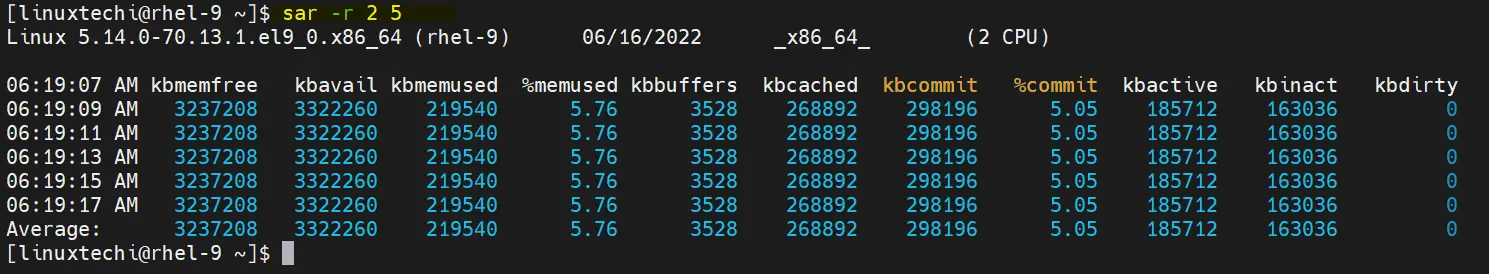
kbcommit & %commit is the overall memory used including RAM & Swap
4) Generating Paging Statistics Report
-B option in the sar command is used to display paging statistics. Example is shown below,
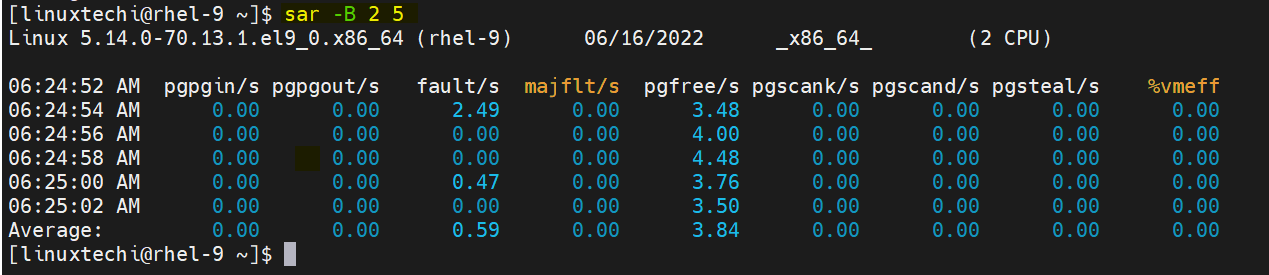
In the report majflts/s shows the major faults per second means number of pages loaded into the memory from disk (swap), if its value is higher then we can say that system is running out of RAM.
%vmeff indicates the number of pages scanned per second, if it’s vaule is 100 % its is consider OK and when it is below 30 % then there is some issue with virtual memory. Zero value indicates that there is no page scanned during that time.
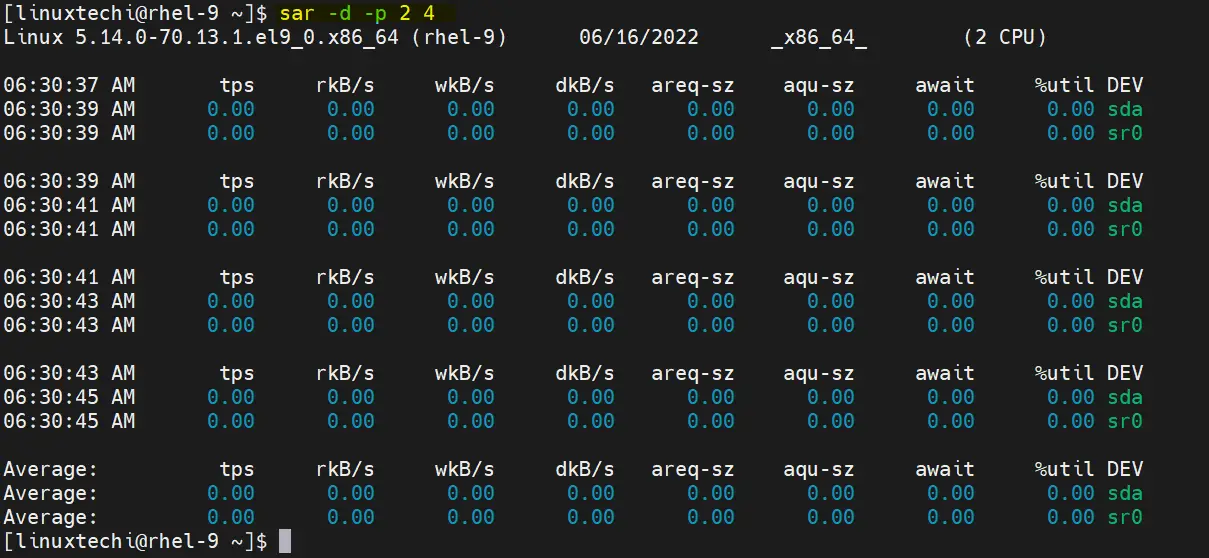
5) Generating Block Device Statistics Report
-d option in the sar command is used to display the block device statistics report. Using option -p (pretty-print) along with -d make the dev column more readable, example is shown below :
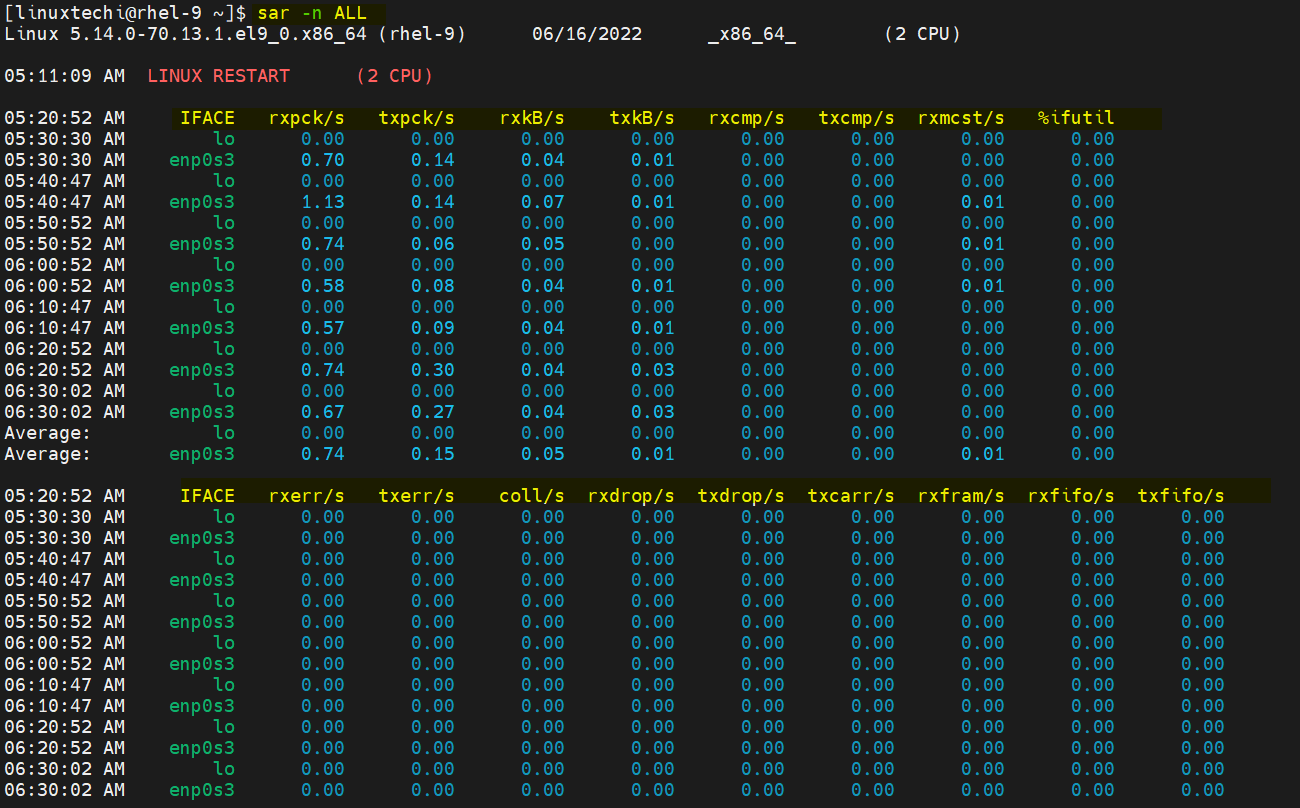
6) Generating Network Statistic Report
-n option in the sar command is used to generate network statistic report. Below is the synatx :
Following keywords can be used : DEV, EDEV, NFS, NFSD, SOCK, IP, EIP, ICMP, EICMP, TCP, ETCP, UDP, SOCK6, IP6, EIP6, ICMP6, EICMP6 & UDP6.
To generate all network statistic report run following command :
7) Reading SAR Log File using -f
As we have stated above that sar logs files are kept under /var/log/sa/saDD , using -f option in sar command we can read these log files. One example is shown below,
18 thoughts on “Generate CPU, Memory and I/O Report using SAR command”
Great tutorial. Next step could be to analyze sar report to get charts and aggregated data. For that we can follow ‘https://github.com/sumitbiswasgit/sarbox’ Reply
Hi, I got results if I use “sar 2 6” . This works perfectly fine. But if I just say sar , it shows “LINUX RESTART” message. The file in /etc/cron.d/sysstat looks fine to me. Not sure whats the issue? Anyone has the same issue? Thanks
Anjum Reply
With which command can I see or generate a file (report) only the use of a full day of use, only the CPU, RAM and Internet Consumption? It is to see the highest points of consumption. Thank you Reply
Hi, Thanks for all the explanation and examples.
After playing around with it to generate reports over the previous day I came to the conclusion that when using the -f and -i option and -s 00:00:00 and -e 23:59:59 the last interval up to midnight is not reported on. In the example below the report goes up to 23:30:01. To me this means the period between 23:30 and 00:00(midnight) is not reported on.
I assume that the time displayed in the report is the end of the interval reports on.
Is there a way to show also the data for the last interval?
Thanks in advance for any help [[email protected]] as $ sar -i 1800 -f /var/log/sa/sa01 -s 00:00:00 -e 23:59:59 -u -t
Linux 3.10.0-1127.19.1.el7.x86_64 (server) 01/01/21 _x86_64_ (8 CPU) 00:00:01 CPU %user %nice %system %iowait %steal %idle
00:30:01 all 1.31 0.03 0.54 0.00 0.00 98.12
01:00:01 all 1.29 0.03 0.54 0.00 0.00 98.14
01:30:01 all 1.30 0.11 0.56 0.00 0.00 98.02
. . .
. . .
22:00:01 all 1.30 0.03 0.54 0.00 0.00 98.12
22:30:01 all 1.30 0.03 0.54 0.00 0.00 98.13
23:00:01 all 1.33 0.03 0.50 0.00 0.00 98.14
23:30:01 all 1.31 0.03 0.49 0.00 0.00 98.17
Average: all 1.31 0.03 0.53 0.00 0.00 98.13 Reply
Hello, This is weird. When selecting SAR data per minute over a period of 24 hours the 59th minute of every hour is not displayed/calculated! Who has any idea about the cause and if it can be solved?!
00:57:01 all 1,77 4,30 0,66 0,00 0,00 93,26
00:58:01 all 2,04 4,63 0,70 0,00 0,00 92,63
01:00:01 all 1,82 4,45 0,68 0,00 0,00 93,06
01:01:01 all 3,25 8,72 1,10 0,01 0,00 86,92
01:57:01 all 2,16 5,34 0,79 0,00 0,00 91,70
01:58:01 all 2,24 5,07 0,77 0,00 0,00 91,92
02:00:01 all 2,19 5,35 0,80 0,00 0,00 91,66
02:01:01 all 2,54 6,31 0,91 0,00 0,00 90,23 Reply
Leave a Comment Cancel reply
Recent Posts

- How to Install PHP 8 on RHEL 8 / Rocky Linux 8 / CentOS 8
- How to Install and Use Wireshark in Ubuntu 22.04
- Top 10 Things to Do After Installing Debian 12 (Bookworm)
- How to Install Debian 12 (Bookworm) Step-by-Step
- How to Upgrade Debian 11 to Debian 12 (Bookworm) via CLI
- How to Setup Dynamic NFS Provisioning in Kubernetes Cluster
- How to Install Nagios on Rocky Linux 9 / Alma Linux 9
- How to Install Ansible AWX on Kubernetes Cluster
- How to Install Docker on Fedora 38/37 Step-by-Step
- How to Setup High Availability Apache (HTTP) Cluster on RHEL 9/8
Pages
Sar для мониторинга производительности системы
Sar -утилита, которая является частью Systat пакета, которую можно использовать для просмотра данных производительности на вашем сервере. Использование системных ресурсов можно увидеть при заданных временных рамках, чтобы помочь решить проблемы с производительностью устранить неполадки или для оптимизации производительности.
Установка Sar
Sysstat можно легко установить с помощью менеджера пакетов yum (CentOS, Red Hat, Fedora):
Sysstat можно легко установить в Ubuntu/ Debian/ linux Mint с помощью команды:
# sudo apt-get install sysstat
Установка включает в себя cron задачу, расположенный в /etc/cron.d/sysstat, который собирает информацию о производительности системы каждые десять минут. Этот интервал опроса может быть изменен если понадобится путем изменения задания в крон. Сейчас мы поправим файлик (ставил и проверял все в Ubuntu 13.4):
# sudo vim /etc/default/sysstat
Меняем строку с ENABLED=”false” на ENABLED=”true” после чего сохраняемся. После чего изменим интервал сбора информации с каждых 10 минут и меняем на каждые 2 минуты, для этого отредактируем:
#Меняем строчку с 5-55/10 * * * * root command -v debian-sa1 > /dev/null && debian-sa1 1 1 #На */2 * * * * root command -v debian-sa1 > /dev/null && debian-sa1 1 1
Перезапустим сервис sysstat :
# sudo service sysstat restart
Использование Sar
Через некоторое время крон выполнит скрипт, чтобы начать сбор данных и команда Sar может быть использована для отображения собранной информации. Выполнение команды без аргументов (без всяких опций) будет предоставлять информацию загрузку системы на текущий день:
Флаги -s (для начала) и -e (для конца) могут быть использованы, чтобы сузить отображаемою информацию в установленный срок:
Для предыдущих дней, вам нужно указать флаг-F, а также путь к этой дней стат файла; которые расположены в /var/log/sa/. Чтобы увидеть данные для 9-го, вы должны использовать файл SA09.
Онлайн информация может быть собрана и отображается, указав интервал сбора и количество раз:
Тема «Sar для мониторинга производительности системы» завершена.