- 15 Useful Performance and Network Monitoring Tools for Linux
- 1. Site24x7’s Linux Monitoring Tool
- Key Features:
- 2. Glances – Real-Time Linux System Monitoring
- Install Glances in Linux
- 3. Sarg – Squid Bandwidth Monitoring
- 4. Apache Status Monitoring
- 5. Monit – Linux Process and Services Monitoring
- Install Monit on Linux
- 6. Sysstat – All-in-One System Performance Monitoring
- Install Sysstat on Linux
- 7. Icinga – Next Generation Server Monitoring
- 8. Observium – Network Management and Monitoring
- 9. Web VMStat – System Statistics Monitoring
- 10. PHP Server Monitoring
- 11. Linux Dash – Linux Server Performance Monitoring
- 12. Cacti – Network and System Monitoring
- 13. Munin – Network Monitoring
- 14. Wireshark – Network Protocol Analyzer
- 15. Webmin
- Use Glances to Monitor Remote Linux in Web Server Mode
- Run Glances in Web Server Mode as a Service
15 Useful Performance and Network Monitoring Tools for Linux
If you’re working as a Linux/Unix system administrator, sure you know that you must have useful monitoring tools to monitor your system performance.
As monitoring tools are very important in the job of a system administrator or a server webmaster, it’s the best way to keep an eye on what’s going on inside your Linux system/server.
You might also like:
Today we’re going to talk about another 15 Linux monitoring tools that you may use to do the job.
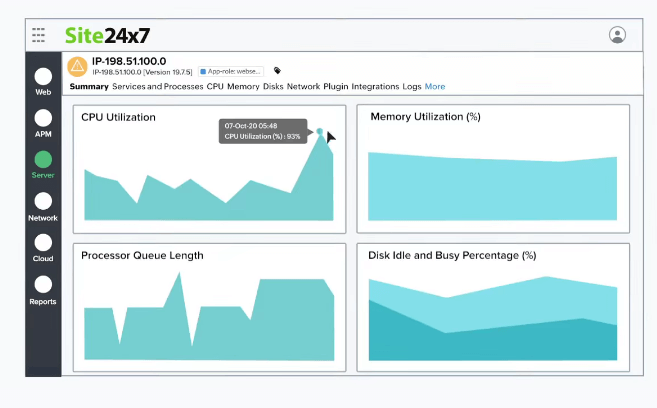
1. Site24x7’s Linux Monitoring Tool
With Site24x7’s monitoring platform, you can eliminate Linux server outages and performance issues by constantly tracking over 60 key performance metrics, including load average, CPU, memory, disk space, network bandwidth utilization, recent events, and Linux processes.
Configure thresholds for key performance metrics and receive instant alerts via SMS, email, mobile app push notifications, and other ITSM and collaboration tools whenever these thresholds are breached.
Site24x7 lets you automate incident remediation and makes your IT operations more agile and efficient.
Key Features:
- Better visibility into the processes that affect your server health and performance with the exclusive Top Process Chart.
- Services monitoring and Syslog monitoring for Linux servers.
- A single console for MSPs to monitor their customers’ IT infrastructures.
- Monitored metrics pushed via StatsD.
- Support for over 100 plugins, including Redis, MySQL, and NGINX.
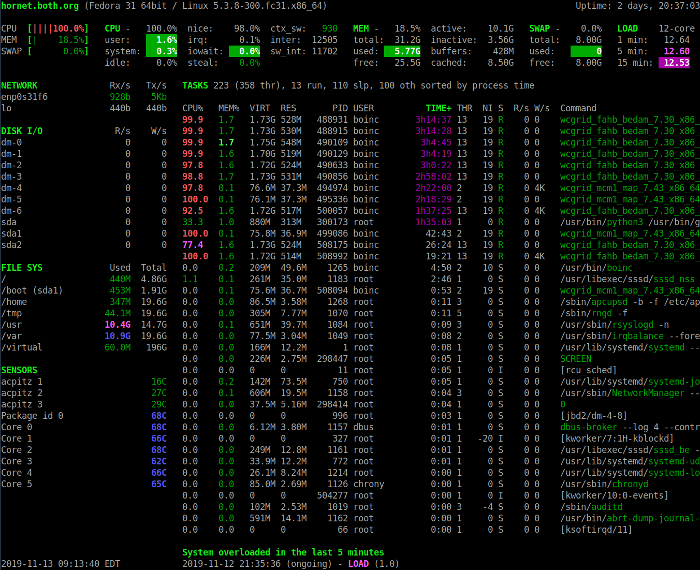
2. Glances – Real-Time Linux System Monitoring
Glances is a monitoring tool built to present as much information as possible in any terminal size, it automatically takes the terminal window size it runs on, in other words, it’s a responsive monitoring tool.
Glances not only show information about CPU and memory usage but also monitor filesystem I/O, network I/O, hardware temperatures, fan speeds, disk usage, and logical volume.
Install Glances in Linux
To install the latest stable version of Glances, just enter the following curl or wget command:
$ curl -L https://bit.ly/glances | /bin/bash or $ wget -O- https://bit.ly/glances | /bin/bash
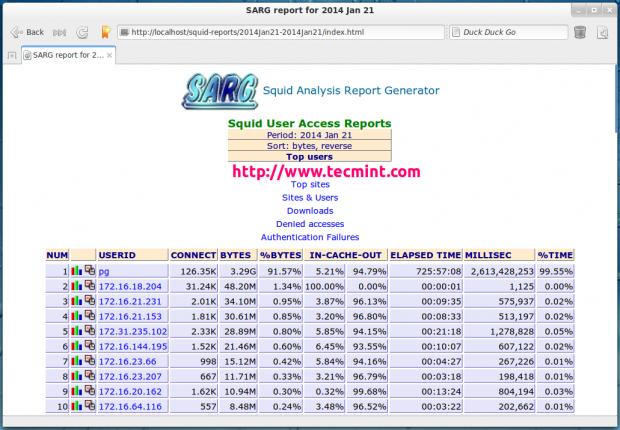
3. Sarg – Squid Bandwidth Monitoring
Sarg (Squid Analysis Report Generator) is a free and open-source tool that acts as a monitoring tool for your Squid proxy server, it creates reports about your Squid proxy server users, IP addresses, the sites they visit, and some other information.
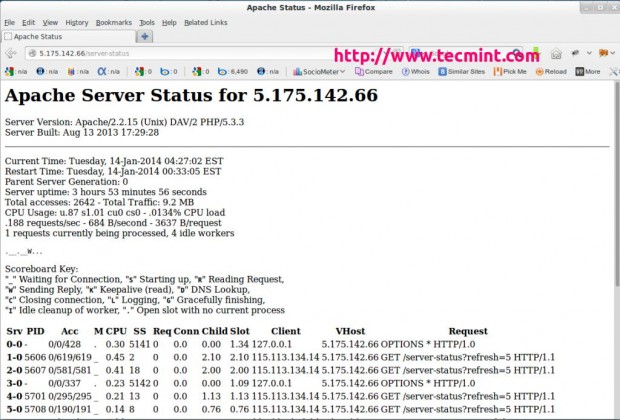
4. Apache Status Monitoring
The mod_status is an Apache server module that allows you to monitor the workers’ status of the Apache server. It generates a report in an easy-to-read HTML format. It shows you the status of all the workers, how much CPU each one using, what requests are currently handled, and the number of working and not working workers.
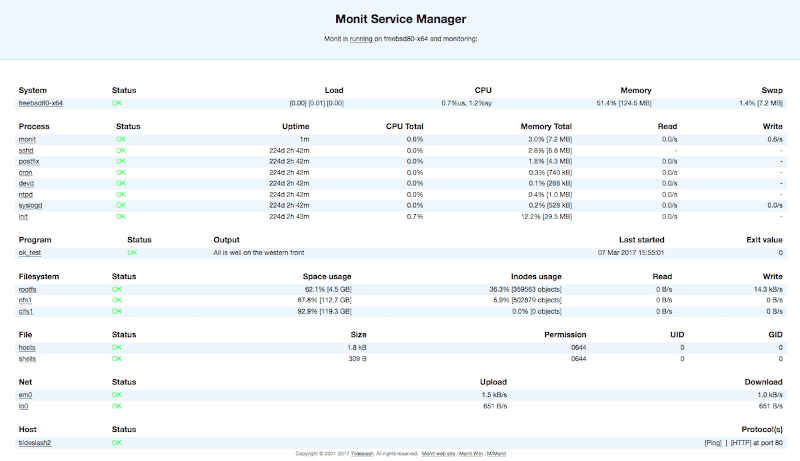
5. Monit – Linux Process and Services Monitoring
Monit is a nice program that monitors your Linux and Unix server, it can monitor everything you have on your server, from the main server (Apache, Nginx..) to file permissions, file hashes, and web services. Plus a lot of things.
Install Monit on Linux
To install the stable version of Monit, just enter the following command line:
$ sudo apt install monit [On Debian, Ubuntu and Mint] $ sudo yum install monit [On RHEL/CentOS/Fedora and Rocky Linux/AlmaLinux] $ sudo emerge -a app-admin/monit [On Gentoo Linux] $ sudo pacman -S monit [On Arch Linux] $ sudo zypper install monit [On OpenSUSE]
6. Sysstat – All-in-One System Performance Monitoring
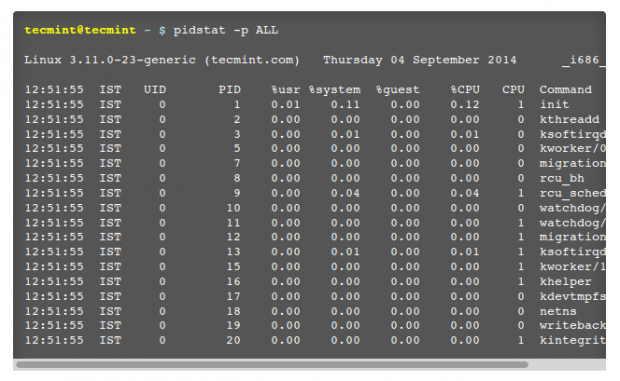
Another useful monitoring tool for your Linux system is Sysstat – is not a real command, in fact, it’s just the name of the project, Sysstat, in fact, is a package that includes many performance monitoring tools like iostat, sadf, pidstat beside many other tools which shows you many statistics about your Linux OS.
Features of Sysstat
- It is available in all modern Linux distribution repositories by default.
- Ability to create statistics about RAM, CPU, and SWAP usage. Besides the ability to monitor Linux kernel activity, NFS server, Sockets, TTY, and filesystems.
- Ability to monitor input & output statistics for devices, tasks.. etc.
- Ability to output reports about network interfaces and devices, with support for IPv6.
- Sysstat can show you the power statistics (usage, devices, the fans’ speed.. etc) as well.
- Many other features…
Install Sysstat on Linux
To install the stable version of Sysstat, just enter the following command line:
$ sudo apt install sysstat [On Debian, Ubuntu and Mint] $ sudo yum install sysstat [On RHEL/CentOS/Fedora and Rocky Linux/AlmaLinux] $ sudo emerge -a app-admin/sysstat [On Gentoo Linux] $ sudo pacman -S sysstat [On Arch Linux] $ sudo zypper install sysstat [On OpenSUSE]
For usage and examples, read our article – 20 Useful Commands of Sysstat
7. Icinga – Next Generation Server Monitoring
Unlike the other tools, Icinga is a network monitoring program, it shows you many options and information about your network connections, devices, and processes, it’s a very good choice for those who are looking for a good tool to monitor networking stuff.
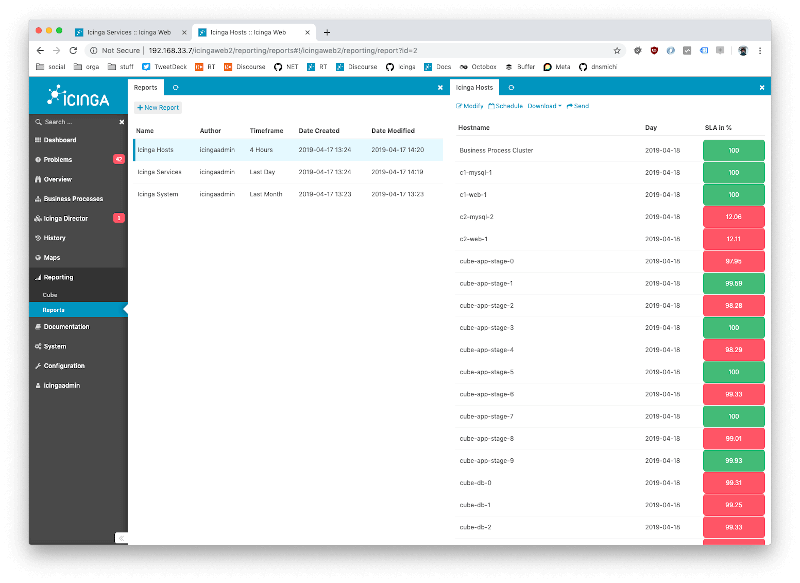
Features of Icinga
- Icinga is also free and open-source.
- Very functional in monitoring everything you may have in networking.
- Support for MySQL and PostgreSQL is included.
- Real-time monitoring with A nice web interface.
- Very expandable with modules and extensions.
- Icinga supports applying services and actions to hosts.
- A lot more to discover…
8. Observium – Network Management and Monitoring
Observium is also a network monitoring tool, it was designed to help you manage your network of servers easily, there are 2 versions of it; Community Edition which is free and open-source, and the Commercial version which costs £1,000/year.
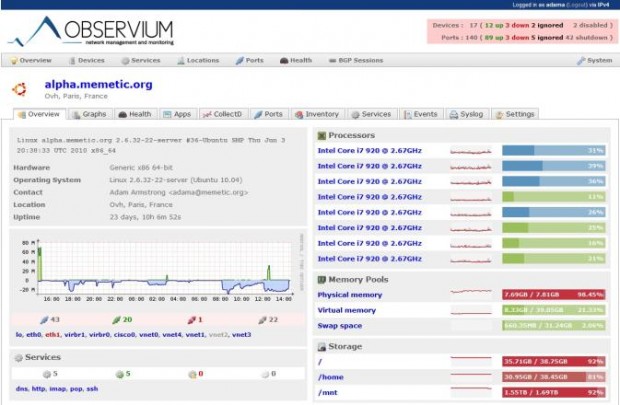
Features of Observium
- Written in PHP with MySQL database support.
- Has a nice web interface to output information and data.
- Ability to manage and monitor hundreds of hosts worldwide.
- The community version from it is licensed under the QPL license.
- Works on Windows, Linux, FreeBSD, and more.
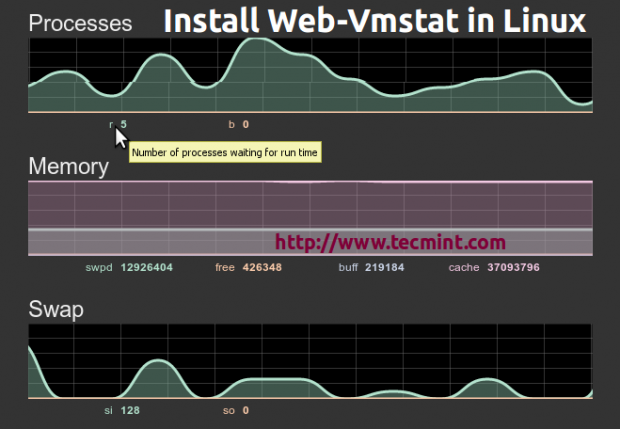
9. Web VMStat – System Statistics Monitoring
Web VMStat is a very simple web application programmer, that provides real-time system information usage, from CPU to RAM, Swap, and input/output information in html format.
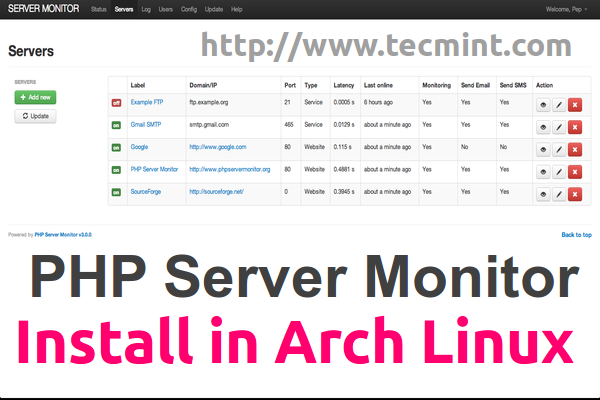
10. PHP Server Monitoring
Unlike the other tools on this list, PHP Server Monitoring is a web script written in PHP that helps you to manage your websites and hosts easily, it supports MySQL database and is released under GPL 3 or later.
Features
- A nice web interface.
- Ability to send notifications to you via Email & SMS.
- Ability to view the most important information about CPU and RAM.
- A very modern logging system to log connection errors and emails that are sent.
- Support for cronjob services to help you monitor your servers and websites automatically.
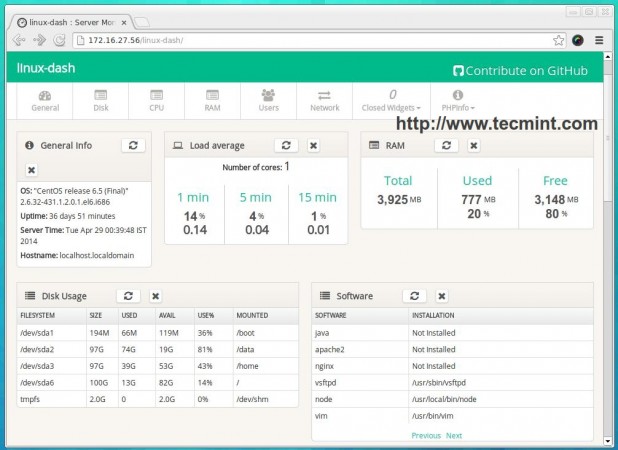
11. Linux Dash – Linux Server Performance Monitoring
From its name, “Linux Dash” is a web dashboard that shows you the most important information about your Linux systems such as RAM, CPU, file system, running processes, users, and bandwidth usage in real-time, it has a nice GUI and it’s free & open-source.
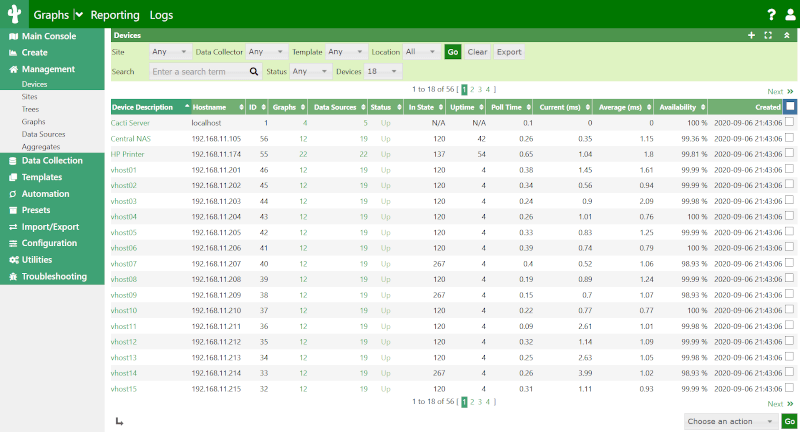
12. Cacti – Network and System Monitoring
Cacti is nothing more than a free & open-source web interface for RRDtool, it is used often to monitor the bandwidth using SNMP (Simple Network Management Protocol), and it can be used also to monitor CPU usage.
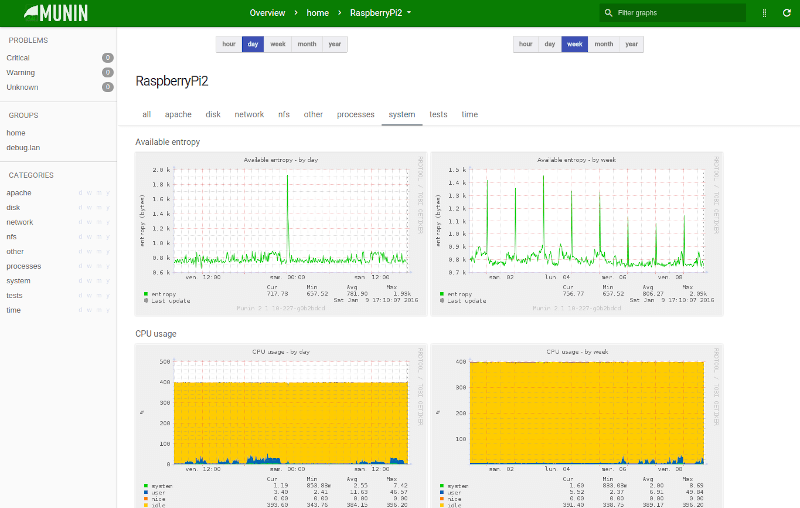
13. Munin – Network Monitoring
Munin is also a web interface GUI for RRDtool, it was written in Perl and licensed under GPL, Munin is a good tool to monitor systems, networks, applications, and services.
It works on all Unix-like operating systems and has a nice plugin system; there are 500+ different plugins available to monitor anything you want on your machine. A notifications system is available to send messages to the administrator when there’s an error or when the error is resolved.
14. Wireshark – Network Protocol Analyzer
Also, unlike all the other tools on our list, Wireshark is an analyzer desktop program that is used to analyze network packets and monitor network connections. It’s written in C with the GTK+ library and released under the GPL license.
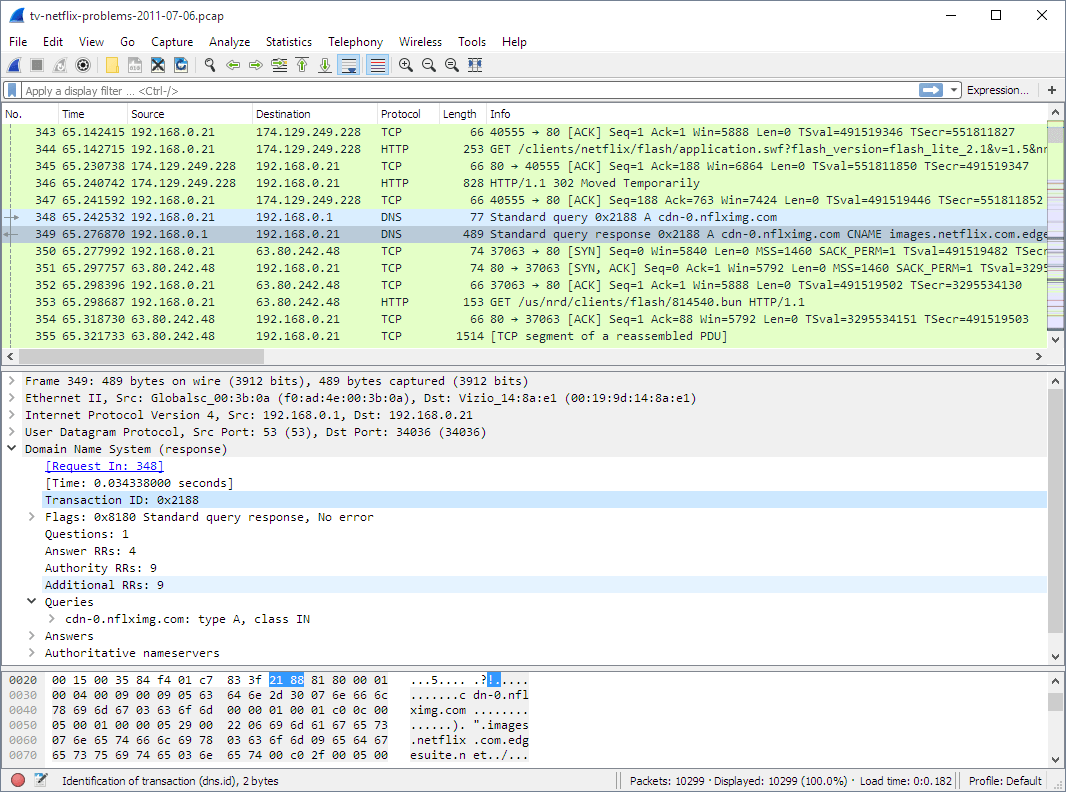
Features
- Cross-platform: it works on Linux, BSD, Mac OS X, and Windows.
- Command-line support: there’s a command-line-based version from Wireshark to analyze data.
- Ability to capture VoIP calls, USB traffic, and network data easily to analyze it.
- Available in most Linux distribution repositories.
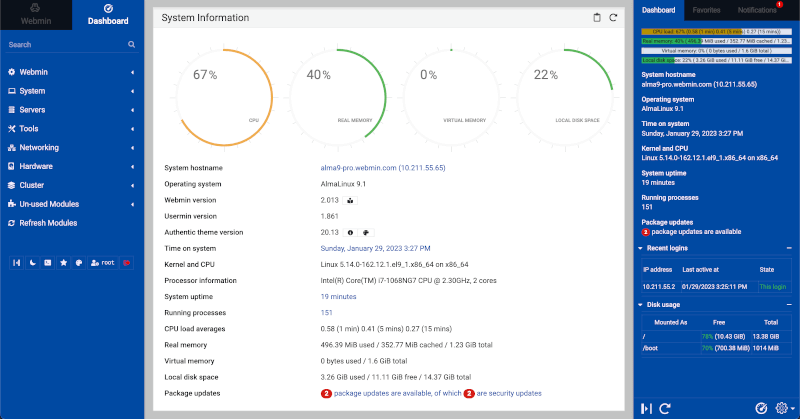
15. Webmin
Webmin is an open-source web-based system and network administration tool (control panel) for Unix-like systems.
Webmin enables you to configure your system internals such as users, services, configuration files, and disk quotes, and manage applications such as Apache, PHP, MySQL and BIND.
Conclusion
These were the most important tools to monitor your Linux/Unix machines, of course, there are many other tools, but these are the most famous. Share your thoughts with us in the comments: What tools & programs do you use to monitor your systems? Have you used any of the tools on this list? What do you think about them?
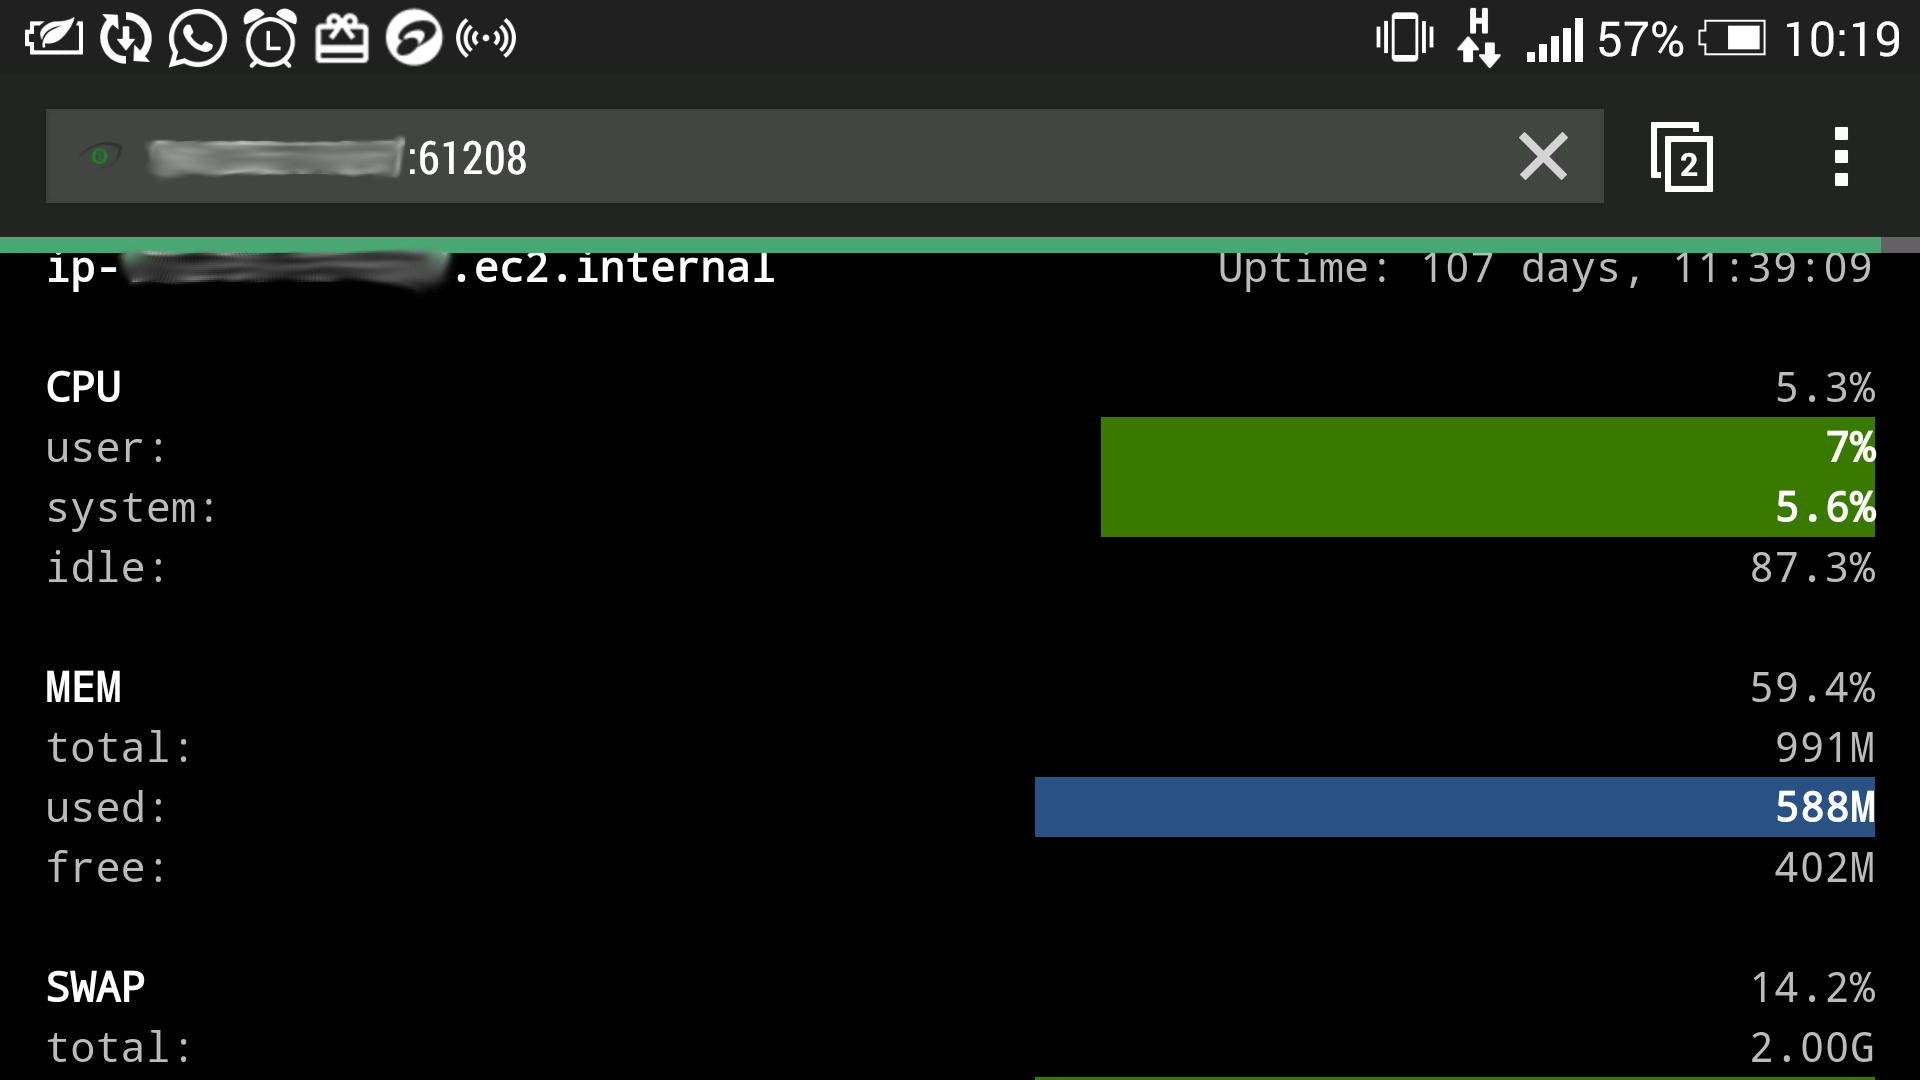
Use Glances to Monitor Remote Linux in Web Server Mode
Glances is a free open source, modern, cross-platform, real-time top and htop like system monitoring tool. It offers advanced features compared to its counterparts, and can run in different modes: as a standalone, in client/server mode and in web server mode.
Considering the web server mode, you do not necessarily need to log into your remote server via SSH to run glances, you can run it in web server mode and access it via a web browser to remotely monitor your Linux server, as explained below.
To run glances in web server mode, you need to install it together with the Python bottle module, a fast, simple and lightweight WSGI micro web-framework, using the appropriate command for your Linux distribution.
$ sudo apt install glances python-bottle #Debian/Ubuntu $ sudo yum install glances python-bottle #RHEL/CentOS $ sudo dnf install glancespython-bottle #Fedora 22+
Alternatively, install it using PIP command like shown.
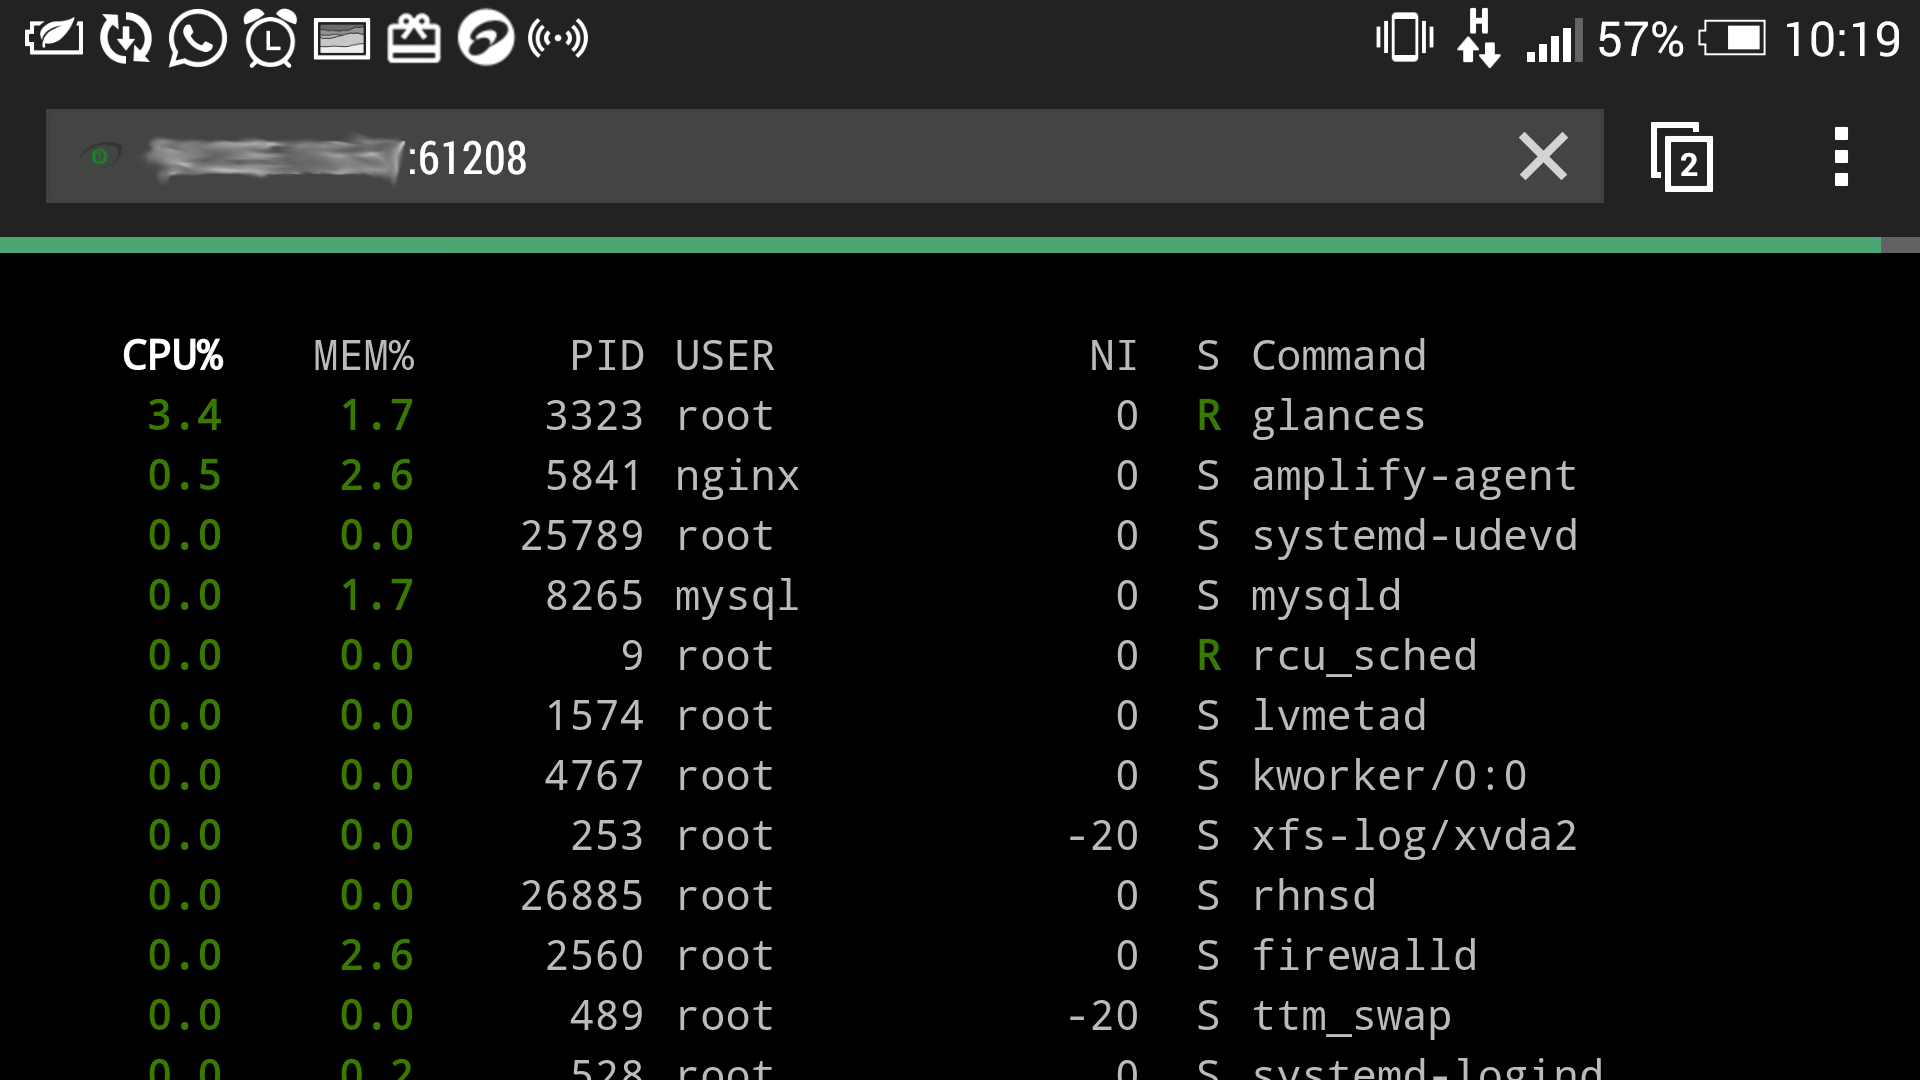
Once you have installed the above packages, launch glances with the -w flag to run it in web server mode. By default, it will listen on port 61208.
If you are running firewalld services, then you should open port 61208 to allow inbound traffic to that port.
$ sudo firewall-cmd --permanent --add-port=61208/tcp $ sudo firewall-cmd --reload
For UFW firewall, run these commands.
$ sudo ufw allow 61208/tcp $ sudo ufw reload
After that, from a web browser, use the URL http://SERVER_IP:61208/ to access the glances UI.
If you are using systemd system and services manager, you can run glances in web server mode as a service for efficient management, as explained in the next section. I actually prefer this method to running it as a background process.
Run Glances in Web Server Mode as a Service
Start by creating your service unit file (which I have preferred to name as glancesweb.service) under /usr/lib/systemd/system/glancesweb.service.
$ sudo vim /usr/lib/systemd/system/glancesweb.service
Then copy and paste the unit file configuration below in it.
[Unit] Description = Glances in Web Server Mode After = network.target [Service] ExecStart = /usr/bin/glances -w -t 5 [Install] WantedBy = multi-user.target
The above configuration tells systemd that this is a unit of type service, it should be loaded after the network.target.
And once the system is in the network target, systemd will invoke the command “/usr/bin/glances -w -t 5” as a service. The -t specifies an interval for live updates in seconds.
The [install] section informs systemd that this service is wanted by “multi-user.target”. Therefore, when you enable it, a symbolic link is created from the /etc/systemd/system/multi-user.target.wants/glancesweb.service to /usr/lib/systemd/system/glancesweb.service. Disabling it will delete this symbolic link.
Next, enable your new systemd service, start and view its status as follows.
$ sudo systemctl enable connection.service $ sudo systemctl start connection.service $ sudo systemctl status connection.service
Finally, from your web browser, use the URL http://SERVER_IP:61208/ to remotely monitor your Linux servers via the glances UI, on any device (smart phone, tablet or computer).
You can change the refresh rate of the page, simply add the period in seconds at the end of the URL, this sets the refresh rate to 8 seconds.
One downside of running glances in web server mode is that, if the Internet connection is poor the client tends to easily disconnect from the server.
You can learn how to create new systemd services from this guide:
That’s all! If you have any questions or additional information to add, use the comment from below.