What is the MCS Index?
The Modulation Coding Scheme (MCS) index is a metric based on several parameters of a WiFi connection between two stations. Namely, for 802.11ac, it depends on the modulation type, the coding rate, the number of spatial streams, the channel width, and the guard interval. Here is what each one of these parameters represent:
Modulation type: the phase and amplitude modulation for bit encoding. More advanced modulations (e.g. 256 QAM) transfer more information, but they are also more susceptible to noise.
Coding rate: how many bits transfer information and how many are used for error correction. Higher values (e.g. ⅚) transfer more information, but there is less room for error correction.
Spatial streams: how many independent data streams are used. Higher values (e.g. 4 streams) increase data rates, but are susceptible to noise and interference.
Channel width: how big is the channel used for the communication. Wider channels can achieve higher bandwidth, but doubling the channel width increases the noise floor by 3 dB, which decreases SNR.
Guard interval: the pause between each packet transmission. Short pauses allow the transmission of more packets, but increase the chances of interference.
With the introduction of 802.11ax the additional parameter that affects MCS is whether the communication uses OFDM or OFDMA.
MCS Table
In a nutshell, an MCS table is a lookup that can be used to find which data rate will be negotiated between two stations once all the connection parameters are known. For each possible combination of modulation, coding rate, number of spatial streams, channel width, and guard interval, there is a unique MCS index.
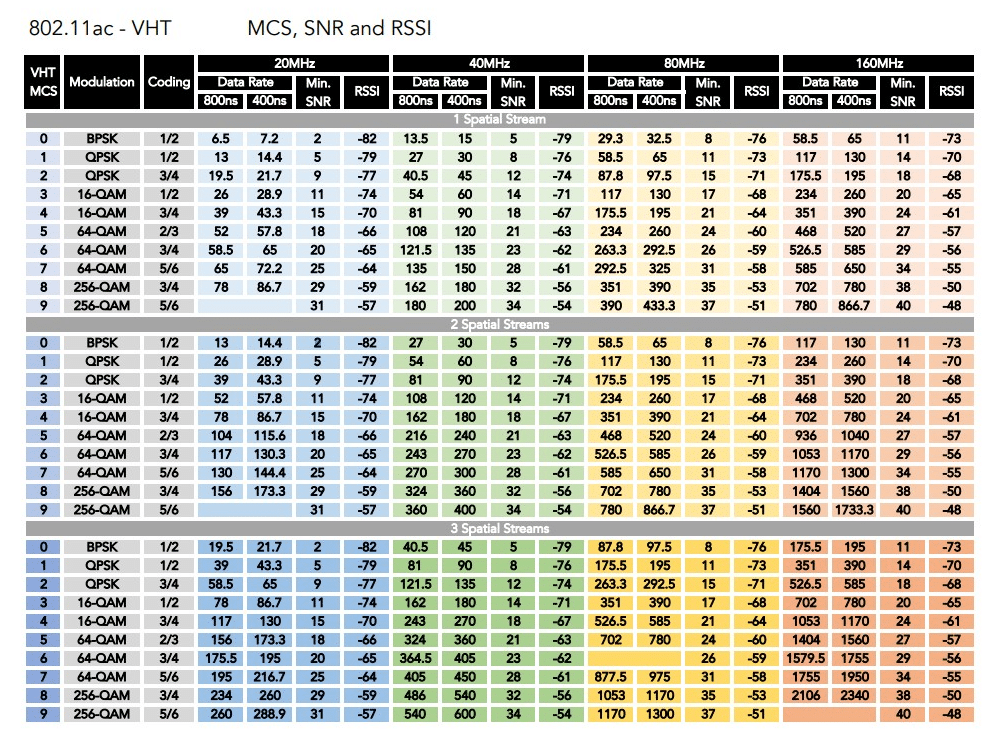
As an example, I will borrow the MCS table for 802.11ac from the WirelessLAN Professionals’ site found here .
The 802.11ax MCS table becomes much larger, and for more details, I would refer you to this post by SemFio. 802.11ax has introduced close to 3000 new possible data rates.
MCS and SNR/RSSI
This table has the additional information of the minimum SNR and RSSI required to achieve a specific MCS index for different channel widths. For example, for 2 spatial streams, and an 80 MHz channel, to get an MCS of 5 you need at least 24 dBM of SNR or -60 RSSI. The relationship between SNR and MCS on this table was taken from Revolution WiFi’s blog .
It’s known that MacOS provides much more in-depth information about its WiFi connectivity. Here is a screenshot of my connection information to the netbeez SSID which you can get with Options+click on the status bar WiFi icon:
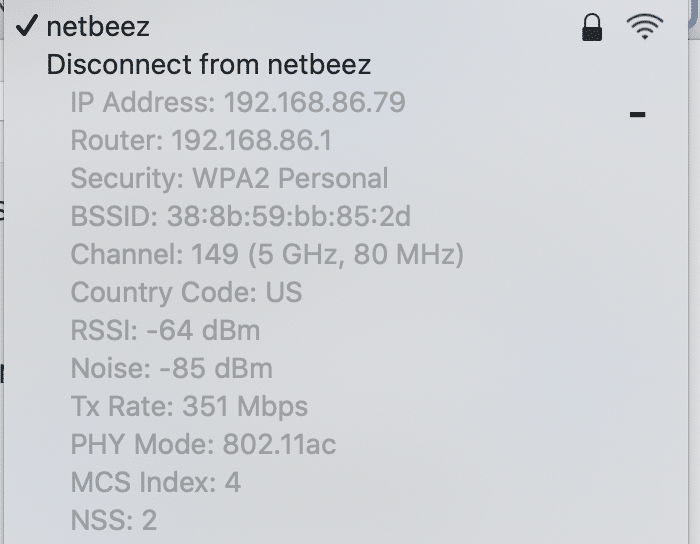
As you can see, it provides the channel width (80 MHz), the RSSI (-64 dBm), the noise (-85 dBm), the Tx Rate (351 Mbps), the standard (802.11ac), the MCS index (4), and the spatial streams (2). Actually, whatever you need to know about the established communication between a MAC and the AP is pretty much readily available.
Now, if you are curious, you can use the MCS table to look up what modulation and coding scheme is used. In this case, you can easily see on the MCS index 4 line under the 2 spatial stream section that it’s using 16-QAM with a ¾ code. On that same line you can also see that the 351 Mbps rate corresponds to 800 ns guard interval, and -64 dBm RSSI with 24 dBm SNR (64 – (-85)) (which match what MacOS is reporting).
Windows is not as friendly to WiFi curious users. On Windows 10 if you type “network properties” you get a list of all available networks on your system. Below we can see the information about my WiFi connection:
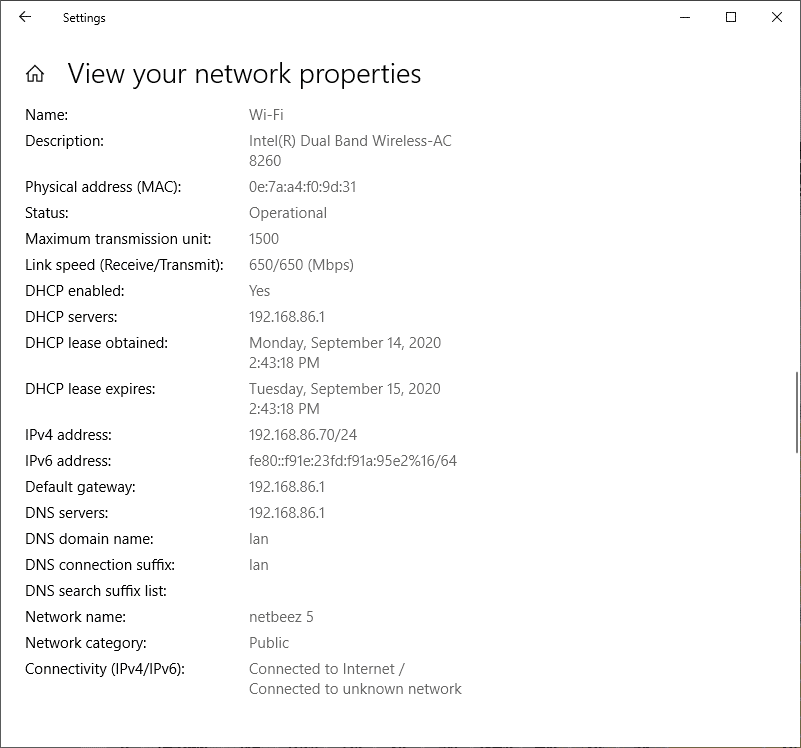
The only relevant information to MCS is the “Link speed (Receive/Transmit): 650/650 (Mbps)”. With that information only, I can go to the MCS table and look up the 650 data rate. It shows up at the 1 spatial stream MCS 7 and 160 MHz channel, and at the 2 spatial streams MCS 7 and 80 MHz channel.
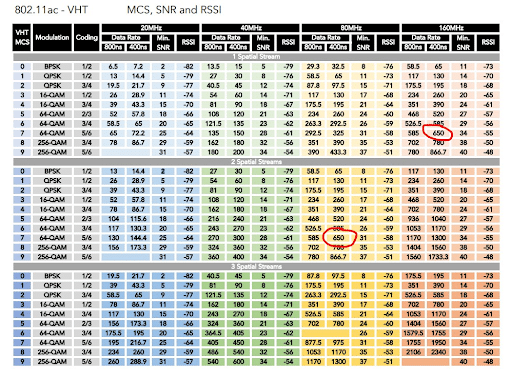
Even for commercial access points, it’s fairly easy to find and configure the channel width. In my case, I know that it’s an 80 MHz channel, and I can derive that the MCS index is 7 with 2 spatial streams, and from there I can find all other information such as modulation (64-QAM), coding (⅚), guard interval (400 ns), minimum SNR (31 dBm) and RSSI (-58 dBm) required.
I wouldn’t be as lucky if Windows 10 was reporting 780 Mbps which shows up 7 times on the table. Even for the 80 MHz channel it appears twice (MCS index 8 and 9).
On MacOS you hardly need the MCS table. For me, the most common use of the table is to derive the minimum SNR and RSSI on Windows and Linux by knowing the data rate. This is useful when I am trying to evaluate the RF environment of a client and consequently troubleshoot connectivity issues.
Spot VPN, ISP, WiFi issues and more with Netbeez
Таблица msc wi fi
Таблица соответствия MCS и скоростей подключения
Скорость подключения 600 Мбит/с достигается только с четырьмя потоками, используя канал шириной в 40 МГц. Различные схемы модуляции и кодирующие показатели определены стандартом и представлены Modulation and Coding Scheme (MCS). Таблица ниже показывает отношение между переменными, которые определяют максимальную скорость подключения к беспроводной сети.
| MCS index | Spatial streams | Modulation type | Coding rate | Data rate (Mbit/s) | |||
|---|---|---|---|---|---|---|---|
| 20 MHz channel | 40 MHz channel | ||||||
| 800 ns GI | 400 ns GI | 800 ns GI | 400 ns GI | ||||
| 0 | 1 | BPSK | 1/2 | 6.50 | 7.20 | 13.50 | 15.00 |
| 1 | 1 | QPSK | 1/2 | 13.00 | 14.40 | 27.00 | 30.00 |
| 2 | 1 | QPSK | 3/4 | 19.50 | 21.70 | 40.50 | 45.00 |
| 3 | 1 | 16-QAM | 1/2 | 26.00 | 28.90 | 54.00 | 60.00 |
| 4 | 1 | 16-QAM | 3/4 | 39.00 | 43.30 | 81.00 | 90.00 |
| 5 | 1 | 64-QAM | 2/3 | 52.00 | 57.80 | 108.00 | 120.00 |
| 6 | 1 | 64-QAM | 3/4 | 58.50 | 65.00 | 121.50 | 135.00 |
| 7 | 1 | 64-QAM | 5/6 | 65.00 | 72.20 | 135.00 | 150.00 |
| 8 | 2 | BPSK | 1/2 | 13.00 | 14.40 | 27.00 | 30.00 |
| 9 | 2 | QPSK | 1/2 | 26.00 | 28.90 | 54.00 | 60.00 |
| 10 | 2 | QPSK | 3/4 | 39.00 | 43.30 | 81.00 | 90.00 |
| 11 | 2 | 16-QAM | 1/2 | 52.00 | 57.80 | 108.00 | 120.00 |
| 12 | 2 | 16-QAM | 3/4 | 78.00 | 86.70 | 162.00 | 180.00 |
| 13 | 2 | 64-QAM | 2/3 | 104.00 | 115.60 | 216.00 | 240.00 |
| 14 | 2 | 64-QAM | 3/4 | 117.00 | 130.00 | 243.00 | 270.00 |
| 15 | 2 | 64-QAM | 5/6 | 130.00 | 144.40 | 270.00 | 300.00 |
| 16 | 3 | BPSK | 1/2 | 19.50 | 21.70 | 40.50 | 45.00 |
| 17 | 3 | QPSK | 1/2 | 39.00 | 43.30 | 81.00 | 90.00 |
| 18 | 3 | QPSK | 3/4 | 58.50 | 65.00 | 121.50 | 135.00 |
| 19 | 3 | 16-QAM | 1/2 | 78.00 | 86.70 | 162.00 | 180.00 |
| 20 | 3 | 16-QAM | 3/4 | 117.00 | 130.70 | 243.00 | 270.00 |
| 21 | 3 | 64-QAM | 2/3 | 156.00 | 173.30 | 324.00 | 360.00 |
| 22 | 3 | 64-QAM | 3/4 | 175.50 | 195.00 | 364.50 | 405.00 |
| 23 | 3 | 64-QAM | 5/6 | 195.00 | 216.70 | 405.00 | 450.00 |
| 24 | 4 | BPSK | 1/2 | 26.00 | 28.80 | 54.00 | 60.00 |
| 25 | 4 | QPSK | 1/2 | 52.00 | 57.60 | 108.00 | 120.00 |
| 26 | 4 | QPSK | 3/4 | 78.00 | 86.80 | 162.00 | 180.00 |
| 27 | 4 | 16-QAM | 1/2 | 104.00 | 115.60 | 216.00 | 240.00 |
| 28 | 4 | 16-QAM | 3/4 | 156.00 | 173.20 | 324.00 | 360.00 |
| 29 | 4 | 64-QAM | 2/3 | 208.00 | 231.20 | 432.00 | 480.00 |
| 30 | 4 | 64-QAM | 3/4 | 234.00 | 260.00 | 486.00 | 540.00 |
| 31 | 4 | 64-QAM | 5/6 | 260.00 | 288.80 | 540.00 | 600.00 |
Взято из http://en.wikipedia.org/wiki/IEEE_802.11n-2009
MCS Index and 7MCS™ Wi-Fi Experience Score
Tells you if your Wi-Fi experience is the best it can be.
MCS Index
The Modulation Coding Scheme (MCS) index is an existing industry metric based on several parameters of a Wi-Fi connection between a client device and a wireless access point, including data rate, channel width, and the number of antennas or spatial streams in the device.
The MCS Index simplifies our understanding data rates. There are hundreds of different 802.11 data rates, so the MCS Index makes it easier to understand them. It describes the modulation type and coding rate used across a set of channel widths, guard intervals, and spatial streams.
As you can see along the left in the diagram below.
- 802.11n MCS values go up to 7
- 802.11ac MCS values, where QAM-256 was introduced, go up to 9
- With 802.11ax, where QAM-1024 was introduced, values go up to 11

Modulation
QAM (quadrature amplitude modulation) modulates amplitude and phase.
- Lower data rate modulation has larger differences between symbols (farther apart — see QPSK in diagram below). This results in greater protection from errors and a more robust Wi-Fi connection. It’s like trying to hit the bullseye on a dartboard when standing right in front of it. easy.
- Higher data rate modulation has smaller differences between symbols (closer together — see 256-QAM in diagram below). This results in less protection from errors and a more fragile Wi-Fi connection. It’s like trying to hit a bullseye on a dartboard from way across the room. Much harder!

Coding
Coding refers to the number of bits required to send «x» number of bits. For example, 3/4 means that 4 bits are used for every 3 data bits sent. The extra bits are for error correction.
Quality of Experience
It may seem like signal strength is a good value to judge connection quality, but unfortunately, signal strength is not measured consistently across Wi-Fi clients, and noise measurements from clients are very poor.
MCS reflects the real Wi-Fi performance a client is able to successfully achieve as it tries to use the highest possible data rate that channel conditions support.
A low MCS score (below 4) indicates that a client is facing significant challenges with its RF environment. Not only is the connection not optimal, but it indicates a serious underlying problem affecting the Wi-Fi experience.
Additionally, MCS abstracts away differing client capabilities like number of spatial streams, making it simpler to compare performance across devices.
MCS reflects the real performance the station has achieved and can be compared across devices and across PHY’s. However, the challenge is that the numbering scale is different depending on your wireless connection and your device’s capabilities.
The only difference between Wi-Fi clients you may see is that, depending on their generation of Wi-Fi and that of the AP they are connected to, they may have differing maximum values (7 for 802.11n, 9 for 802.11ac, and 11 for 802.11ax connections).
7MCS™ Wi-Fi Experience Score
Windows® does not expose MCS, so 7SIGNAL developed 7MCS which provides an MCS value for Windows 10 that may also be used for Mac’s.
In addition, 7MCS adjusts MCS values from 802.11n so that they are no longer specific to a number of spatial streams. Also, 7MCS values can be compared across all Wi-Fi generations from 802.11n to 802.11ax. Think of it as a simple quality of experience rating scale, from 0 to 11, regardless of PHY or operating system.
| MCS | Modulation | Coding | Quality |
| 0 | BPSK | 1/2 | ⛔ |
| 1 | QPSK | 1/2 | ⛔ |
| 2 | QPSK | 3/4 | ⛔ |
| 3 | 16-QAM | 1/2 | ⚠️ |
| 4 | 16-QAM | 3/4 | ⚠️ |
| 5 | 64-QAM | 2/3 | ✅ |
| 6 | 64-QAM | 3/4 | ✅ |
| 7 | 64-QAM | 5/6 | ✅ |
| 8 | 256-QAM | 3/4 | ✅ |
| 9 | 256-QAM | 5/6 | ✅ |
| 10 | 1024-QAM | 3/4 | ✅ |
| 11 | 1024-QAM | 5/6 | ✅ |