- How to Benchmark Your Linux System
- Distributions
- Requirements
- Conventions
- Introduction
- Sysbench
- Install Sysbench
- CPU
- Memory
- I/O
- GeekBench
- Hardinfo
- Install Hardinfo
- Using Hardinfo
- Phoronix Test Suite
- Installation and Graphics Tests
- John The Ripper
- LuxMark
- Compile Firefox
- Compress Gzip
- Closing Thoughts
- Related Linux Tutorials:
- Бенчмарки для Linux-серверов: 5 открытых инструментов
- Sysbench
- UnixBench
- Phoronix Test Suite
- Vdbench
- IOzone
How to Benchmark Your Linux System
Use GeekBench, Sysbench, Hardinfo, and Phoronix Test Suite to benchmark your Linux system.
Distributions
This will work on most modern distributions.
Requirements
A working Linux install with root privileges.
Conventions
- # – requires given linux command to be executed with root privileges either directly as a root user or by use of sudo command
- $ – given linux command to be executed as a regular non-privileged user
Introduction
There are a bunch of reasons that you’d want to benchmark your Linux system. Most people benchmark out of pure curiosity or to measure the system’s performance for games. Benchmarking can also help you identify problems with your system, though, and improve weak points for a smoother and more efficient experience. Benchmarking also helps you identify possible software issues and problematic upgrades with regressions.
There are a number of great ways to benchmark your Linux system. This guide will cover a few of the most common ones. Using any number of these will give you a good perspective of what your system can do, and where its possible weak points are.
Sysbench
Sysbench is a mutli-purpose benchmark that features tests for CPU, memory, I/O, and even database performance testing. It’s a basic command line utility that offers a direct and uncomplicated way to test your system.
Install Sysbench
Start by installing Sysbench on your system. It’s available from most distribution repositories.
Ubuntu/Debian
$ sudo apt install sysbench
Sysbench is available from the AUR. Go to its page, and follow your preferred procedure to install it.
CPU

All the tests are fairly straightforward. You can run the test with —test=X run . Change the run to help to get the options specific to that test.
Why not start out by running the CPU test. It’s probably the most common one that you’ll want to check, especially if you’re an overclocker.
The test will take a bit of time to run, and afterward, you’ll see your results printed out in the terminal.
Memory
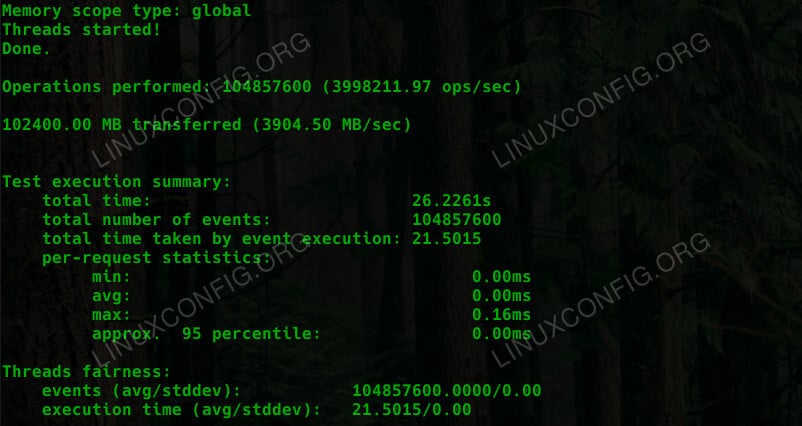
The memory test follows the exact same rules as the CPU one. Run it too.
Once again, you’ll see your results in the terminal.
I/O
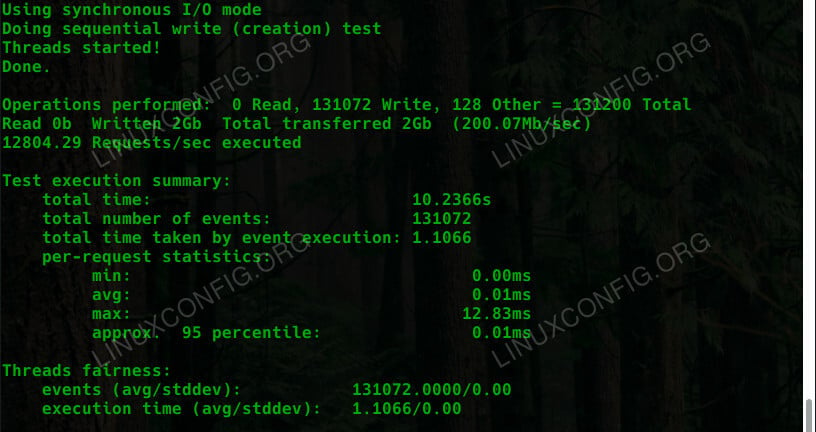
The file I/O test is a little different. You also need to tell it which type of I/O test to run. You can see the available tests by running the help command for the test. A basic sequential write looks like this:
$ sysbench --test=fileio --file-test-mode=seqwr run
Just like the others, you’ll see a report when it’s done.
GeekBench
GeekBench is another complete test suite that’s available for Linux. GeekBench automatically puts your system through a battery of tests and produces a complete set of results as well as an overall score.
You can head over to the GeekBench website, and download the latest release for Linux. GeekBench is proprietary software and comes as a set of binaries in a tarball. When it’s finished downloading, unpack the tarball wherever is convenient.
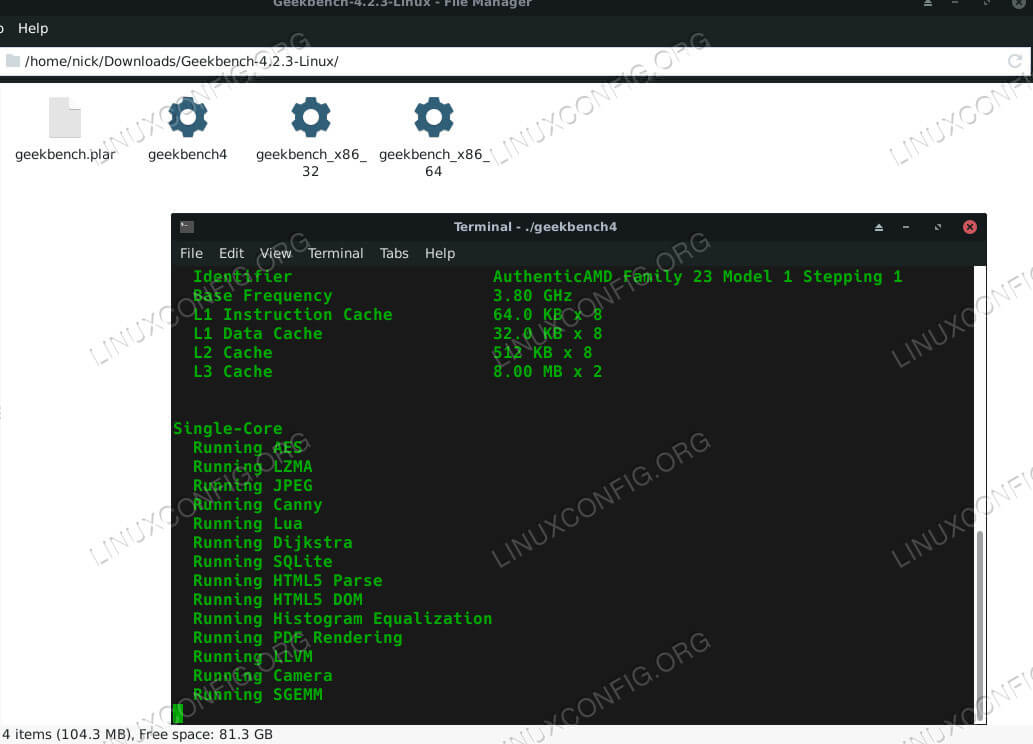
Open a terminal in the GeekBench directory that you just unpacked, and run the binary to start your test.
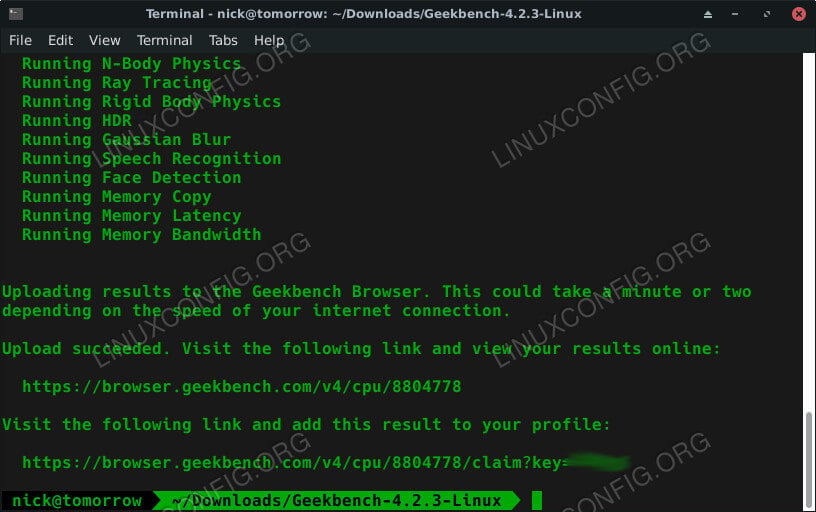
After the test, Geekbench will give you a URL to view your complete test results.
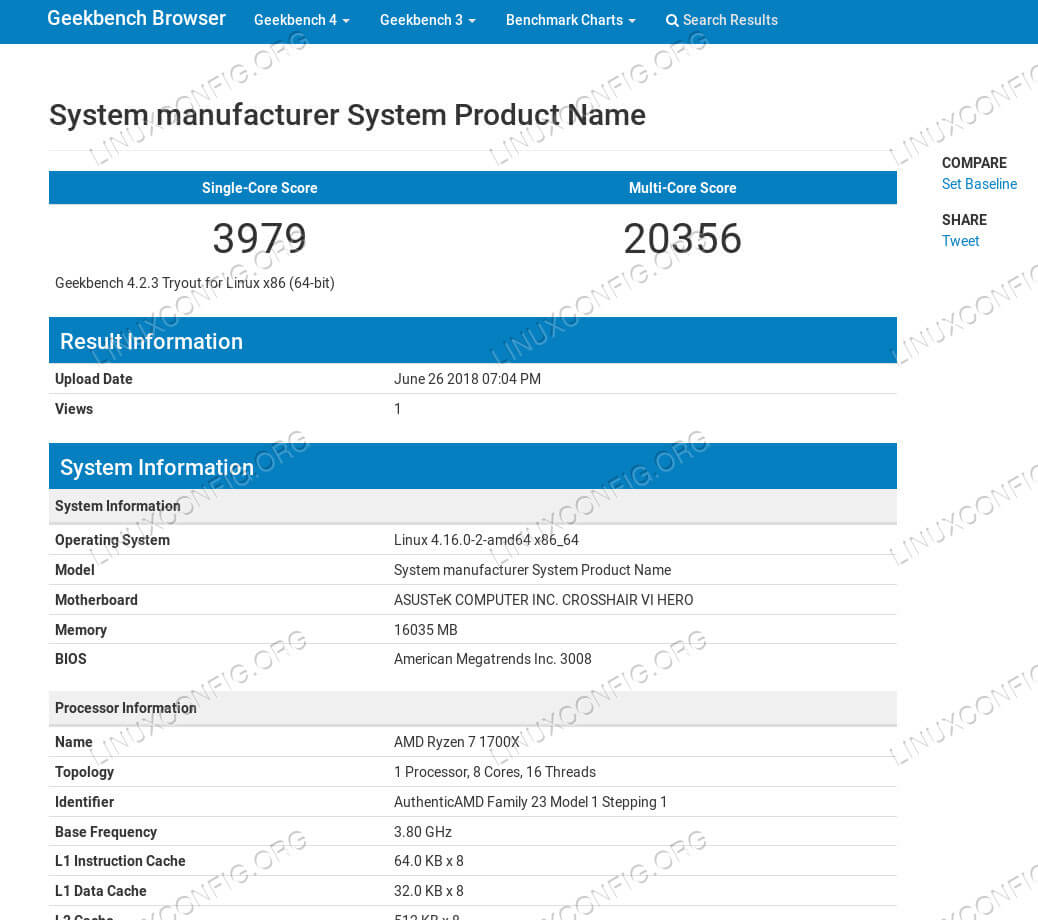
The results are organized in a table, with your complete score on top. As you scroll through the table, you’ll see your results on specific tests that GeekBench ran.
Hardinfo
Hardinfo is a great utility that provides both detailed system information and a series of basic benchmarks. It’s open source, and it’s available in most distribution’s repositories.
Install Hardinfo
Ubuntu/Debian
$ sudo apt install hardinfo
For some reason, the Fedora developers decided to stop packaging Hardinfo, so you’ll need to build it yourself.
# dnf install glib-devel gtk+-devel zlib-devel libsoup-devel $ cd Downloads $ git clone https://github.com/lpereira/hardinfo.git $ cd hardinfo $ mkdir build $ cd build $ cmake .. $ make # make install
Using Hardinfo
Open up Hardinfo on your computer. It’s a graphical utility, and it should be categorized under System by your distribution’s launcher.
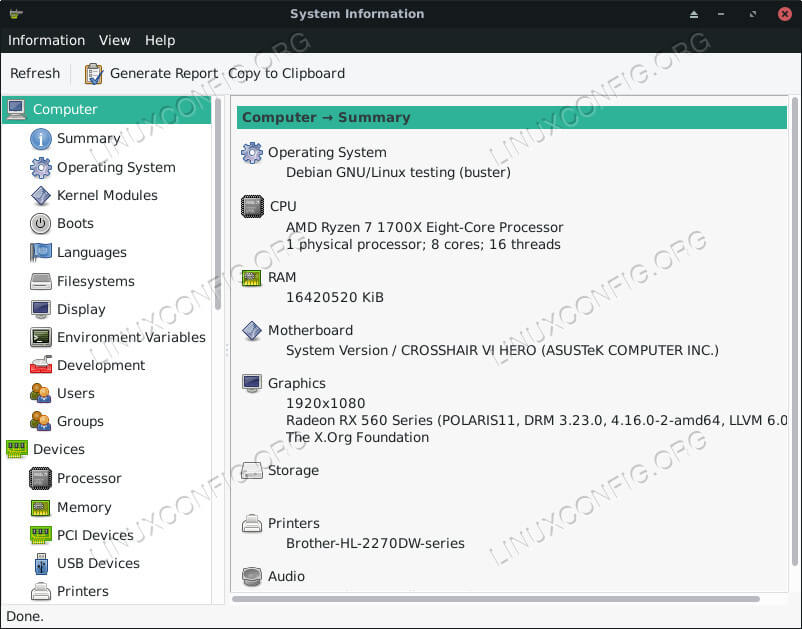
Once it’s open, you’ll see a listing of tabs to the left organized by category and the information contained in those tabs on the right. Feel free to click through the tabs, and check out the info about your system. There’s a lot of detailed readouts that can provide some insight without the need to run a test.
The final category at the bottom of the list is “Benchmarks.” There are only a handful there, but they all can be pretty useful. Click on the tab you want, and Hardinfo will run the benchmark. When it’s finished, it’ll display your results in the right pane.
Phoronix Test Suite
Phoronix Test Suite is a complete benchmark suite that curates loads of Linux benchmark tools under one umbrella with PHP scripts.
Installation and Graphics Tests
For information on how to install Phoronix Test Suite on your distribution and run graphics tests, check out our guide on graphics benchmarking with PTS. When you have the suite installed and working, you can move on to the rest of the tests here.
The rest of these tests are just a sampling of what Phoronix Test Suite has. They’re more general purpose and practical tests.
John The Ripper

John The Ripper is a classic password cracking program used by security testers, but the stress that it places on your CPU makes it an ideal program to test with. Start by installing the test.
$ phoronix-test-suite install john-the-ripper
When that finishes, run the test.
$ phoronix-test-suite run john-the-ripper
The test will run three times, and you’ll see your results displayed in the terminal.
LuxMark
LuxMark is another performance test that measures both OpenCL performance of both the CPU and GPU. They’re both obviously important parts of your computer as a whole, and this test is also great if you plan on using your computer for any compute tasks.
$ phoronx-test-suite install luxmark
$ phoronix-test-suite run luxmark
Compile Firefox
Firefox is a beast of a program. It’s absolutely massive, and it takes a lot of time and system resources to compile. If you really want to test your system, especially your CPU to the max, try compiling Firefox.
$ phoronix-test-suite install compile-firefox $ phoronix-test-suite run compile-firefox
Compress Gzip
Gzip compression is another great example of a practical test that you can conduct on your Linux system. Chances are, you use gzip on a regular basis, so measuring its performance gives you a real world way to see how your system stacks up.
$ phoronix-test-suite install compress-gzip $ phoronix-test-suite run compress-gzip
Closing Thoughts
You now have a full set of tools to benchmark your Linux system. With these, you can accurately asses the strength of your system and its performance compared to other computers. You also have a way of rooting out the weakest links and upgrading them.
Related Linux Tutorials:
Comments and Discussions
Бенчмарки для Linux-серверов: 5 открытых инструментов
Сегодня мы расскажем об открытых инструментах для оценки производительности процессоров, памяти, файловых систем и систем хранения данных.
В список вошли утилиты, предлагаемые резидентами GitHub и участниками тематических тредов на Reddit, — Sysbench, UnixBench, Phoronix Test Suite, Vdbench и IOzone.
Sysbench
Это — утилита для нагрузочного тестирования MySQL-серверов, основанная на проекте LuaJIT, в рамках которого разрабатывается виртуальная машина для языка Lua. Автор инструмента — программист и эксперт по MySQL Алексей Копытов. Проект начинался как хобби, но со временем обрел признание сообщества. Сегодня sysbench используют в своей работе крупные университеты и ИТ-организации вроде IEEE.
Во время конференции SECR-2017 (запись выступления есть на YouTube) Алексей рассказал, что sysbench позволяет оценить производительность базы данных при переносе на новое оборудование, обновлении версии СУБД или резком изменении числа запросов. В общем случае синтаксис команды для проведения теста выглядит следующим образом:
sysbench [options]. [testname] [command]Эта команда определяет тип (cpu, memory, fileio) и параметры нагрузочного теста (количество потоков, число запросов, скорость обработки транзакций). В целом инструмент способен обрабатывать миллионы событий за секунду. Подробнее об архитектуре и внутреннем устройстве sysbench Алексей Копытов рассказал в одном из выпусков подкаста Software Development Podcast.
UnixBench
Набор инструментов для оценки производительности Unix-систем. Его представили инженеры из университета Монаша в 1983 году. С того момента поддержкой инструмента занималось множество людей, например, авторы журнала о микрокомпьютерных технологиях Byte Magazine и участник LKML Дэвид Ниеми (David Niemi). За выход следующей версии инструмента отвечает Энтони Воэлм (Anthony Voellm) из Microsoft.
UnixBench представляет собой набор индивидуальных тестов. Они сопоставляют скорость выполнения кода на машине под управлением Unix с производительностью эталонной системы, в роли которой выступает SPARCstation 20-61. На основе этого сравнения генерируется балл, определяющий производительность.
Среди доступных тестов числятся: Whetstone, который описывает эффективность операций с плавающей точкой, File Copy, оценивающий скорость копирования данных, и несколько 2D и 3D-бенчмарков. Полный список тестов можно найти в репозитории на GitHub. Многие из них используют для оценки производительность виртуальных машин в облаке.
Phoronix Test Suite
Этот комплекс тестов разработан авторами веб-ресурса Phoronix, на котором публикуются новости о дистрибутивах GNU/Linux. Впервые Test Suite представили в 2008 году — тогда он включал 23 различных теста. Позже разработчики запустили облачный сервис OpenBenchmarking.org, на котором пользователи могли публиковать собственные тестовые сценарии. Сегодня на нем представлено около 60 бенчмарк-наборов, в том числе связанных с машинным обучением и технологией ray-tracing.
Наборы специализированных скриптов позволяют протестировать отдельные компоненты системы. С их помощью можно оценить время компиляции ядра и кодирования видеофайлов, скорость сжатия архиваторов и др. Для запуска тестов достаточно написать соответствующую команду в консоли. Например, эта команда инициирует оценку производительности CPU:
phoronix-test-suite benchmark smallptВо время тестирования Test Suite самостоятельно контролирует состояние оборудования (температуру CPU и скорость вращения кулеров), защищая систему от перегрева.

/ Unsplash / Jason Chen
Vdbench
Инструмент для генерации I/O-нагрузки на дисковые системы, разработанный Oracle. Он помогает оценить производительность и целостность СХД (о том, как посчитать теоретическую производительность дисковой системы, мы подготовили краткую справку).
Работает решение следующим образом: на реальной системе запускается программа SWAT (Sun StorageTek Workload Analysis Tool), которая создает дамп со всеми обращениями к диску за определённый период. Записываются метка времени, тип операции, адрес и размер блока данных. Далее, используя файл с дампом, vdbench эмулирует нагрузку на любой другой системе.
Список параметров для управления утилитой есть в официальном документе Oracle. Исходный код утилиты можно найти на сайте компании.
IOzone
Консольная утилита для оценки производительности файловых систем. Она определяет скорость чтения, записи и перезаписи файлов. В разработке инструмента приняли участие десятки программистов, но автором его первой версии считается инженер Уильям Норкотт (William Norcott). Разработку поддержали такие компании, как Apple, NetApp и iXsystems.
Для управления потоками и их синхронизации во время тестирования инструмент использует стандарт POSIX Threads. По завершении работы IOzone выдает отчет с результатами или в текстовом формате, или в виде электронной таблицы (Excel). Также инструмент имеет в составе скрипт gengnuplot.sh, который строит по данным таблиц трехмерный график. Примеры таких графиков можно найти в документации к инструменту (стр. 11–17).
IOzone доступен в качестве тестового профайла в уже упомянутом Phoronix Test Suite.
Дополнительное чтение из наших блогов и социальных сетей:
Баг в Linux 5.1 приводил к потере данных — корректирующий патч уже вышел
Есть мнение: технология DANE для браузеров провалилась
 Зачем нужен мониторинг?
Резервное копирование файлов: как подстраховаться от потери данных
Как перенести системный жесткий диск в виртуальную машину?
 Все говорят об утечках ПД — чем поможет IaaS-провайдер
Короткий ликбез: как устроена ЭЦП
Справочная: как работает закон о персональных данных