Как оценить производительность СХД на Linux: бенчмаркинг с помощью открытых инструментов
В прошлый раз мы рассказывали об инструментах с отрытым исходным кодом для оценки производительности процессоров и памяти. Сегодня говорим о бенчмарках для файловых систем и систем хранения данных на Linux — Interbench, Fio, Hdparm, S и Bonnie.
Fio
Fio (расшифровывается как Flexible I/O Tester) создает потоки ввода/вывода данных с диска, чтобы оценить производительность файловой системы Linux. Утилиту можно запустить и на Windows — нужно установить интерфейс командной строки Cygwin. Руководство по настройке есть в репозитории fio на GitHub.
Автор fio — Йенс Аксбо (Jens Axboe), ответственный за подсистему IO в Linux и разработчик утилиты blktrace для трассировки операций ввода/вывода. Он создал fio, потому что устал писать программы для тестирования специфической нагрузки вручную.
Утилита посчитает IOPS и пропускную способность системы, а также позволит оценить глубину очереди операций ввода/вывода. Утилита работает со специальными файлами (расширение .fio), в которых прописываются настройки и условия теста. Вариантов тестов несколько, например, есть произвольная запись, чтение и перезапись. Вот пример содержимого файла для первого случая:
[global] name=fio-rand-read filename=fio-rand-read rw=randread bs=4K direct=0 numjobs=1 time_based=1 runtime=900 Сегодня fio используется крупными компаниями — с утилитой работают в SUSE, Nutanix и IBM.
Hdparm
Утилиту написал канадский разработчик Марк Лорд (Mark Lord) в далеком 2005 году. Она до сих пор поддерживается автором и является частью многих популярных дистрибутивов. Главное назначение hdparm — настройка параметров накопителей. Но инструмент можно использовать для проведения простых бенчмарков, например, измерения скорости чтения. Для этого нужно написать в консоли команду:
Система сформирует подобный ответ:
Timing buffered disk reads: 242 MB in 3.01 seconds = 80.30 MB/secЧто касается настройки накопителей, то hdparm позволяет менять объем кеш-памяти, модифицировать параметры спящего режима и электропитания, а также безопасно стирать данные на SSD. Но, как предупреждают специалисты из ArchLinux, неосторожное изменение системных параметров может сделать данные на диске недоступными и даже повредить накопитель. Перед работой с hdparm лучше ознакомиться с руководством — достаточно прописать в консоли команду man hdparm.
S
Это — набор бенчмарков для оценки производительности систем ввода/вывода. Авторами утилиты выступила команда разработчиков из группы AlgoDev, в которую входят сотрудники итальянского Университета Модены и Реджо-Эмилии.
Все бенчмарки представляют собой bash-скрипты, оценивающие производительность системы хранения данных — пропускную способность, латентность, работу планировщиков. К примеру, бенчмарк throughput-sync.sh «бомбардирует» СХД запросами на чтение или запись (в этом случае используется уже упомянутая утилита fio). Вот код этого скрипта.
Другой скрипт — comm_startup_lat.sh — измеряет задержку чтения данных с диска при «холодном кэше» (когда в нем нет необходимых данных). Код также можно найти в репозитории.

Фото — Agê Barros — Unsplash
Bonnie
Утилита для оценки производительности файловой системы, разработанная в 1989 году. Её автором выступил инженер Тим Брей (Tim Bray). С помощью Bonnie он планировал оптимизировать работу вычислительных систем, задействованных в проекте New Oxford English Dictionary в Университете Ватерлоо.
Bonnie выполняет произвольное чтение и запись данных на диск. После утилита показывает такие параметры, как число обработанных байтов за CPU-секунду, а также уровень загрузки процессора в процентах. Исходный код бенчмарка можно найти на Google Code.
На основе Bonnie построен другой комплекс инструментов для тестирования жесткого диска — Bonnie++ (написан на C++, вместо C). В нем приведены дополнительные бенчмарк-инструменты. Например, zcav для оценки производительности различных зон HDD. Также Bonnie++ подходит для тестирования почтовых серверов и серверов баз данных.
Interbench
Утилиту разработал Кон Коливас (Con Kolivas), австралийский анестезиолог, который известен своим вкладом в разработку ядра Linux и работой над «справедливым планировщиком процессора». Interbench помогает настроить параметры планировщика ввода/вывода и файловой системы.
Interbench эмулирует поведение планировщика CPU при выполнении интерактивных задач. Этими интерактивными задачами могут выступать работа со звуком и видео, запуск компьютерных игр или простое перетаскивание диалогового окна в операционной системе.
Исходный код, примеры и рекомендации по настройке инструмента можно найти в официальном репозитории на GitHub.
О чем мы пишем в наших блогах:

Бенчмарки для Linux-серверов: 5 открытых инструментов
 Резервное копирование файлов: как подстраховаться от потери данных
Как перенести системный жесткий диск в виртуальную машину?
Тренировочный стенд для админов: чем поможет облако
Досмотры гаджетов на границе: как действовать, чтобы не потерять конфиденциальные данные?
Снэпшоты: зачем нужны «снимки»
How to Check Disk Performance (IOPS and Latency) in Linux?
In this article we will discuss how to check the performance of a disk or storage array in Linux. IOPS (input/output operations per second) is the number of input-output operations a data storage system performs per second (it may be a single disk, a RAID array or a LUN in an external storage device). In general, IOPS refers to the number of blocks that can be read from or written to a media.
Most disk manufacturers specify nominal IOPS values, but in fact these are not guaranteed. To understand the performance of your storage subsystem prior to starting a project, it is worth getting the maximum IOPS values your storage can handle.
Using FIO (Flexible I/O) Tool for Storage Benchmarking
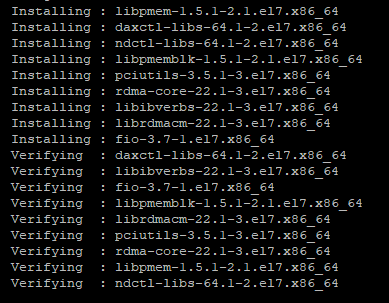
To measure disk IOPS performance in Linux, you can use the fio (the tool is available for CentOS/RHEL in EPEL repository). So, to install fio in RHEL or CentOS, use the yum (dnf) package manager:
# yum install epel-release -y
# yum install fio -y
Or apt-get in Debian or Ubuntu:
Then you to identify the disks to test. The test is done by performing read/write operations in the directory your disk or LUN is mounted to.
Let’s do several types of disk IOPS performance tests in various disk load scenarios (a test mode you select depending on a hosted app logic and general infrastructure of a project).
Random Read/Write Operation Test
When running the test, an 8 GB file will be created. Then fio will read/write a 4KB block (a standard block size) with the 75/25% by the number of reads and writes operations and measure the performance. The command is as follows:
# fio —randrepeat=1 —ioengine=libaio —direct=1 —gtod_reduce=1 —name=fiotest —filename=testfio —bs=4k —iodepth=64 —size=8G —readwrite=randrw —rwmixread=75
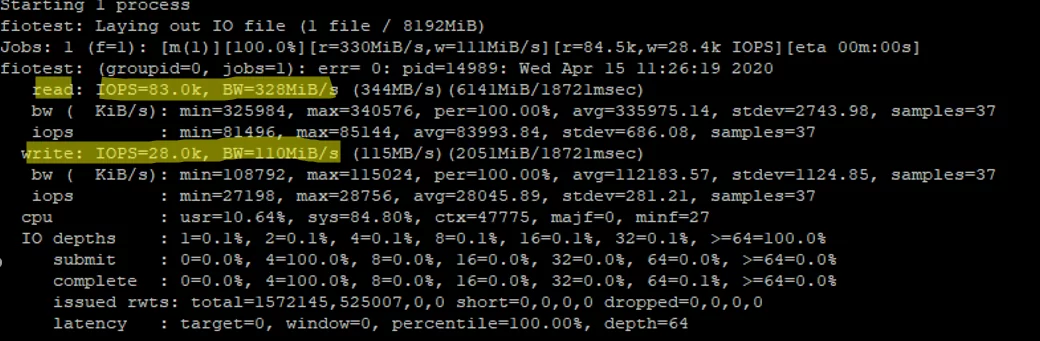
I ran my first test on an array that consisted of two SSDs and got good results:
- Read: 3280MiB/s, IOPS avg 83000
- Write: 110MiB/s, IOPS avg 28000
Since we have run a combined read/write test, the values for the separate tests will be higher.
In comparison, I measured the performance on a SATA drive:
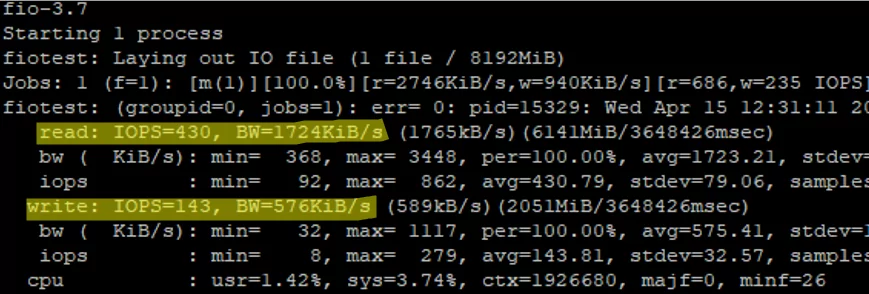
Of course, the HDD results are worse than those of the SSD.
Random Read Operation Test
To measure disk performance for random read operations only, run the following command:
# fio —randrepeat=1 —ioengine=libaio —direct=1 —gtod_reduce=1 —name=fiotest —filename=testfio —bs=4k —iodepth=64 —size=8G —readwrite=randread
The final part of the command was changed to —readwrite=randread .
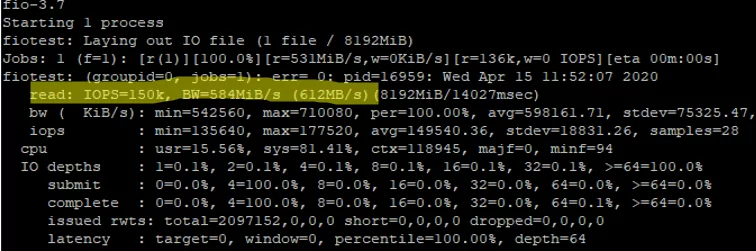
As I told earlier, the read/write performance will be higher if measured separately:
READ: IOPS=150k, BW=584MiB/s (612MB/s)
Random Write Operation Test
To measure disk performance for random write operations, run this command:
# fio —randrepeat=1 —ioengine=libaio —direct=1 —gtod_reduce=1 —name=fiotest —filename=fiotest —bs=4k —iodepth=64 —size=8G —readwrite=randwrite
WRITE: IOPS=84.7k, BW=331MiB/s (347MB/s)
Write operation performance on good SSDs is also very high. Like in read operation test, the difference as compared to a mixed test reaches 200-250 MiB/s and 50000 IOPS.
If you refer to the official manufacturer documentation (these are Intel SSDs), it is safe to say that the values are true.
Fio Config File Examples
Fio allows to check disk performance using interactive commands and with configuration files prepared in advance for testing. To use the this option, create a file:
And add the following contents into it:
[global] rw=randread size=8G filename=/tmp/testfio ioengine=libaio iodepth=4 invalidate=1 direct=1 [bgread] rw=randread iodepth=64
The test will measure the read performance of a disk. To test write performance, use the following config file:
[global] rw=randwrite size=8G filename=/tmp/testfio ioengine=libaio iodepth=4 invalidate=1 direct=1 [bgwrite] rw=randwrite iodepth=64
Measuring Disk Latency Using Ioping
Besides IOPS, there is another important parameter that characterizes the quality of your storage: it is latency. Latency is an input/output request delay that determines the time of access to a storage (measured in milliseconds). The higher the latency is, the more your app has to wait till it gets data from your disk. The latency values over 20 ms for typical data storage systems are considered poor.
To check disk latency in Linux, the ioping tool is used:
Run the latency test for your disk (20 requests are run):
The average value is 298.7 us (microseconds), so the average latency in our case is 0.3 ms, that is excellent.
The latency value can be specified in us (microseconds) or ms (milliseconds). To get a ms value from an us one, divide it by 1,000.
So you can perform a storage load test on your server prior to launching a project and check the highest performance values. However, the test doesn’t guarantee that your disk array or disk will show the same performance constantly, but it is worth to take the test on the initial stage of a project. Learn how to test IOPS in Windows in this article.