- Top Command Output Explained: An Introduction for Beginners
- Understanding and Interpreting the Ouptut of the Linux `top` Command
- Result Row #1
- Result Row #2
- Result Row #3
- Result Row #4
- Result Row #5
- Result Row #6 ( Running Processes )
- Short Results Based on Specific Fields
- Conclusion
- Related Posts
- Understanding the LD_LIBRARY_PATH Environment Variable
- The Beginner’s Guide to Building Your First RPM Package
- The Beginner’s Guide to Building Your First Debian Package
- 16 Comments
Top Command Output Explained: An Introduction for Beginners
The `top` command is a Linux utility that is used to display real-time information about running processes on a system. It provides a summary of the current state of the system, including the CPU, memory, and swap usage, as well as a list of running processes and their resource utilization.
Using the top command is simple: just enter `top` at the command prompt and press Enter. The top command will display a list of running processes, along with their process IDs, CPU and memory usage, and other information. By default, the list is sorted by CPU usage, with the most CPU-intensive processes at the top.
Using this article, I am trying to explain understanding and interpreting the Output of the Linux `top` Command
Understanding and Interpreting the Ouptut of the Linux `top` Command
The top command is a Linux utility that is used to display real-time information about running processes on a system. When you run the top command, it displays a list of running processes, along with their process IDs, CPU and memory usage, and other information. Here’s how to read and interpret the output of the top command:
Result Row #1
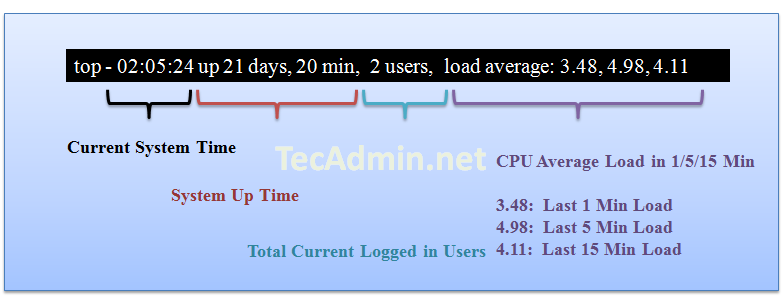
Row 1 results show about server uptime from the last reboot, currently logged-in users, and CPU load on the server. The same output you can find using Linux uptime command.
Result Row #2
Row 2 shows the number of processes running on the server and their state.
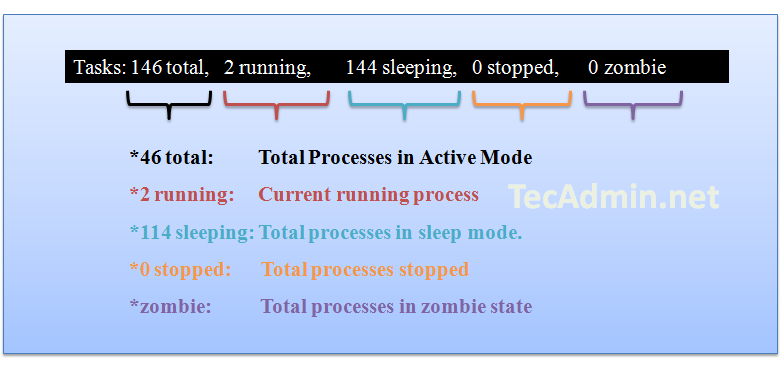
Zombie process or defunct process is a process that has completed execution but still has an entry in the process table. This entry is still needed to allow the parent process to read its child’s exit status.
Result Row #3
Row three shows the CPU utilization status on the server, you can find here how much CPU is free and how much is utilized by the system.
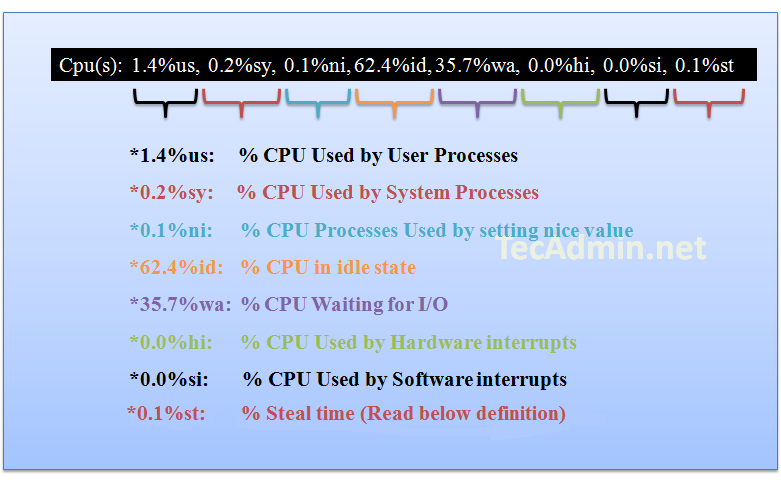
Steal time is the time that a virtual CPU waits for a real CPU while the hypervisor is servicing another virtual processor.
Definition from access.redhat.com
Result Row #4
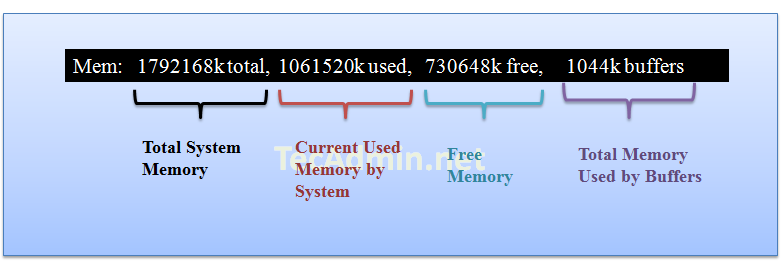
Row 4 shows the memory utilization on the server, you can find here how much memory is used, the same results you can find using free command.
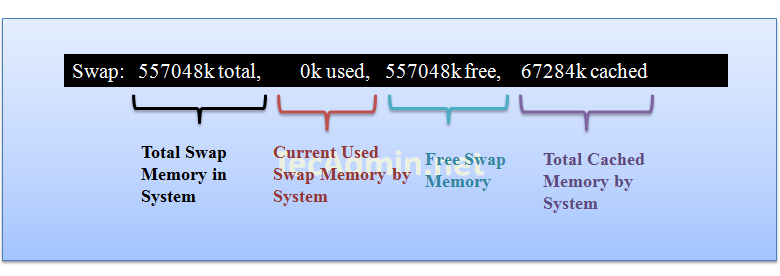
Result Row #5
Row 5 shows the swap memory utilization on the server, you can find here how much swap is being used, the same results you can find using free command.
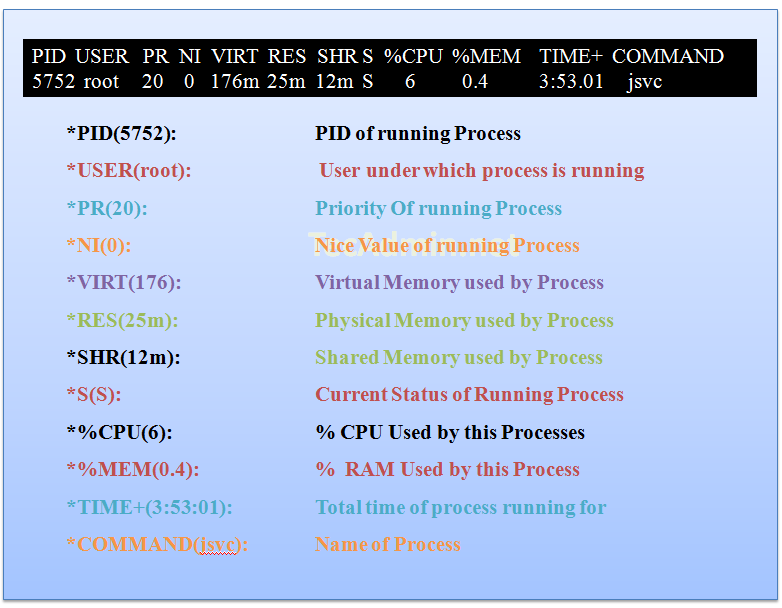
Result Row #6 ( Running Processes )
In these steps, you will see all the running processes on servers with additional details.
Short Results Based on Specific Fields
You can also sort the results based on the specific field. Use the following key combination to do short.
Press `SHIFT + F` and Select your choice below and press ENTER.
- A : PID = Process Id
- b : PPID = Parent Process Pid
- d : UID= User Id
- e : USER = User Name
- f : GROUP = Group Name
- g : TTY= Controlling Tty
- h : PR = Priority
- i : NI = Nice value
- j : P = Last used cpu (SMP)
- k : %CPU = CPU usage
- l : TIME = CPU Time
- n : %MEM = Memory usage (RES)
- o : VIRT = Virtual Image (kb)
- p : SWAP = Swapped size (kb)
- q : RES= Resident size (kb)
- r : CODE = Code size (kb)
- s : DATA = Data+Stack size (kb
- t : SHR= Shared Mem size (kb)
- w : S = Process Status
- x : COMMAND= Command name/line
Conclusion
In conclusion, a top command is a powerful tool that is used to display real-time information about running processes on a Linux system. When you run the top command, it displays a list of running processes, along with their process IDs, CPU and memory usage, and other information. By understanding and interpreting the output of the top command, you can get a better understanding of the current state of the system and the resources being used by various processes. With this knowledge, you can use the top command to monitor and manage processes on your Linux system more effectively.
Related Posts
Understanding the LD_LIBRARY_PATH Environment Variable
The Beginner’s Guide to Building Your First RPM Package
The Beginner’s Guide to Building Your First Debian Package
16 Comments
Hi Please check the typo mistake.(in row3 last line ni–>st).this one helped me much. Thank you,
siva kumar reddy.
Awesome explanation, however %ni has been repeated twice which should be %st : steal time in the CPU Usage Section. Please correct it. Thanks
Abhimanyu Singh
You are missing a key point or am i? In result row #1 you have the load averge of cpu time in 1min, 5min and 15min. Results are:
3.48 @ 1min.
4.98 @ 5min.
4.11 @ 15min. but what those there number mean.? it cannot be a readout of the CPU load averge over 1min, you CPU would be idle most of the time if the averge load is 3.48, on my linux machine this number is less than 1. So wtf is it. Well it’s not like your Windows friendly view, it’s linux and thank god. It’s hard to explain and maybe someone else can do it better but here goes. Lets say your system is running with a 4 core CPU, on a Windows PC you would see the 4 cores and the average load each sec. You can’t simply move one thing to another core, just like you can’t walk through two doors at the same time.
However my wife would arguing this. We can’t do two things at the same time, but if we have two doors, why not send one thing through one door and another through the next and so on. Btw a CPU with hyperthreading is not a core…! So lets say it’s a 4 core CPU, and we have the same average load of 3.48 the first minute, then 4.98 every 5 minute and 4.11 every 15minute. We can translate this to 3 of the cores are at 100% load, and one if at 48%.
However this is not true, as we cannot see each core, but the totalt amount so we can only guess. This should tell you that there is still a good 52% left on one core, and we don’t need to raise an alarm depending on the average load every 5 or 15min.
Now every 5min we have a load over 4. It’s 4.98 and i lost you again. If we have 4 core where every core can max at 1 why do we have above 4 on a 4 core system? Well this counter is so much more, it’s current load or a givin load over a time, it’s the amount the system would like to utilize over a givin periode of time.
WTF.! stop plz. Yeah i know, if only it was Windows and we could all die in a puddel of licens.
Install htop, it would give you a more “user friendly” view. On debian you should just apt-get install htop
redhat users should add repoforge anyway. Now that we know our system is overloaded, how can we fix it? By using top to see what is hooking all the CPU time. Hope you can update you’re guide to include what these numbers mean as they are not the amount of CPU load in % You can find this number on a linux machine with this command cat /proc/cpuinfo | grep ‘model name’ | wc -l
Hey, This article seems to basic informative with variable explanations within top command, why are you arguing with load values. Also please specify why your are specifying overload with 4 core! Does the article mentioned in such a way. Last but not least, Please do manner in your replies….:)