Remotely debug Python code on Linux
Applies to: ![]() Visual Studio
Visual Studio ![]() Visual Studio for Mac
Visual Studio for Mac ![]() Visual Studio Code
Visual Studio Code
Visual Studio can launch and debug Python applications locally and remotely on a Windows computer (see Remote debugging). It can also debug remotely on a different operating system, device, or Python implementation other than CPython using the debugpy library.
When using debugpy, the Python code being debugged hosts the debug server to which Visual Studio can attach. This hosting requires a small modification to your code to import and enable the server, and may require network or firewall configurations on the remote computer to allow TCP connections.
For Visual Studio 2019 version 16.4 and earlier, the ptvsd library was used. The debugpy library replaced ptvsd 4 in Visual Studio 2019 version 16.5.
Set up a Linux computer
The following items are needed to follow this walkthrough:
- A remote computer running Python on an operating system like Mac OSX or Linux.
- Port 5678 (inbound) opened on that computer’s firewall, which is the default for remote debugging.
This walkthrough is based on Visual Studio 2019 version 16.6.
You can easily create a Linux virtual machine on Azure and access it using Remote Desktop from Windows. Ubuntu for the VM is convenient because Python is installed by default; otherwise, see the list on Install a Python interpreter of your choice for additional Python download locations.
For details on creating a firewall rule for an Azure VM, see Open ports to a VM in Azure using the Azure portal.
Prepare the script for debugging
import random guesses_made = 0 name = input('Hello! What is your name?\n') number = random.randint(1, 20) print('Well, , I am thinking of a number between 1 and 20.'.format(name)) while guesses_made < 6: guess = int(input('Take a guess: ')) guesses_made += 1 if guess < number: print('Your guess is too low.') if guess >number: print('Your guess is too high.') if guess == number: break if guess == number: print('Good job, ! You guessed my number in guesses!'.format(name, guesses_made)) else: print('Nope. The number I was thinking of was '.format(number)) Note It’s a good idea to record the version of debugpy that’s installed in case you need it for troubleshooting; the debugpy listing also shows available versions.
import debugpy debugpy.listen(('0.0.0.0', 5678)) In addition to listen and wait_for_client , debugpy also provides a helper function breakpoint , which serves as a programmatic breakpoint if the debugger is attached. There is also an is_client_connected function that returns True if the debugger is attached (note that there is no need to check this result before calling any other debugpy functions).
Attach remotely from Python Tools
In these steps, we set a simple breakpoint to stop the remote process.
- Create a copy of the remote file on the local computer and open it in Visual Studio. It doesn’t matter where the file is located, but its name should match the name of the script on the remote computer.
- (Optional) To have IntelliSense for debugpy on your local computer, install the debugpy package into your Python environment.
- Select Debug >Attach to Process.
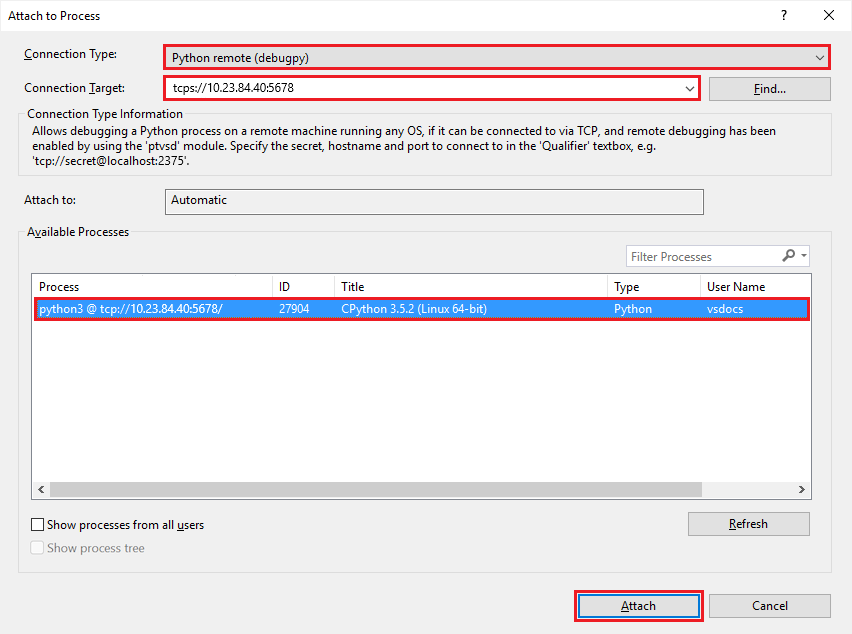
- In the Attach to Process dialog that appears, set Connection Type to Python remote (debugpy).
- In the Connection Target field, enter tcp://:5678 where is that of the remote computer (which can be either an explicit address or a name like myvm.cloudapp.net), and :5678 is the remote debugging port number.
- Press Enter to populate the list of available debugpy processes on that computer:
 If you happen to start another program on the remote computer after populating this list, select the Refresh button.
 - Select the process to debug and then Attach, or double-click the process.
- Visual Studio then switches into debugging mode while the script continues to run on the remote computer, providing all the usual debugging capabilities. For example, set a breakpoint on the if guess < number: line, then switch over to the remote computer and enter another guess. After you do so, Visual Studio on your local computer stops at that breakpoint, shows local variables, and so on:
- When you stop debugging, Visual Studio detaches from the program, which continues to run on the remote computer. debugpy also continues listening for attaching debuggers, so you can reattach to the process again at any time.
 If you happen to start another program on the remote computer after populating this list, select the Refresh button.
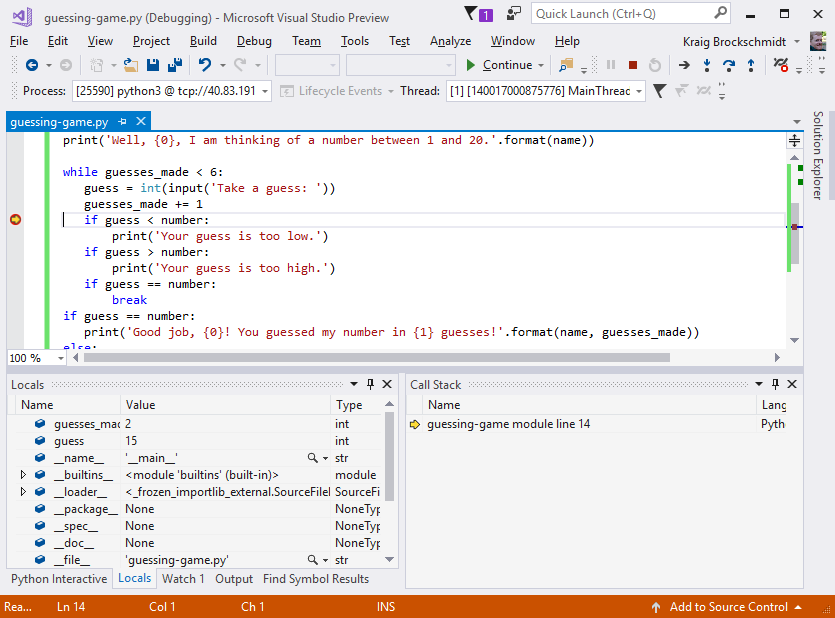
Connection troubleshooting
- Make sure that you’ve selected Python remote (debugpy) for the Connection Type
- Check that the secret in the Connection Target exactly matches the secret in the remote code.
- Check that the IP address in the Connection Target matches that of the remote computer.
- Check that you’ve opened the remote debugging port on the remote computer, and that you’ve included the port suffix in the connection target, such as :5678 .
- If you need to use a different port, you can specify it in the listen , as in debugpy.listen((host, port)) . In this case, open that specific port in the firewall.
- Check that the version of debugpy installed on the remote computer as returned by pip3 list matches that used by the version of the Python tools you’re using in Visual Studio in the table below. If necessary, update debugpy on the remote computer.
Visual Studio version Python tools/debugpy version 2019 16.6 1.0.0b5 2019 16.5 1.0.0b1
Visual Studio 2019 version 16.0-16.4 utilized ptvsd, not debugpy. The process in this walkthrough for those versions is similar, but the function names are different. Visual Studio 2019 version 16.5 uses debugpy, but the function names were the same as those in ptvsd. Instead of listen , you would use enable_attach . Instead of wait_for_client , you would use wait_for_attach . Instead of breakpoint , you would use break_into_debugger .
Using ptvsd 3.x for legacy debugging
Visual Studio 2017 versions 15.8 and later use a debugger based on ptvsd version 4.1+. Visual Studio 2019 versions 16.5 and later use a debugger based on debugpy. These versions of the debugger are compatible with Python 2.7 and Python 3.5+. If you’re using Python 2.6, 3.1 to 3.4, or IronPython, Visual Studio shows the error, Debugger does not support this Python environment. The following information applies only to remote debugging with ptvsd 3.x.
- With ptvsd 3.x, the enable_attach function required that you pass a «secret» as the first argument that restricts access to the running script. You enter this secret when attaching the remote debugger. Though not recommended, you can allow anyone to connect, use enable_attach(secret=None) .
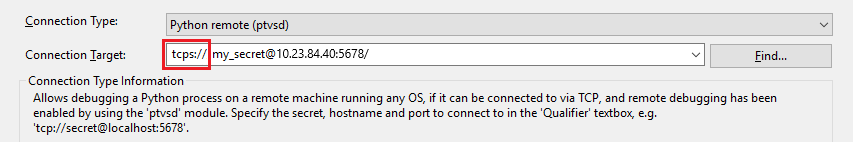
- The connection target URL is tcp://@:5678 where is the string passed enable_attach in the Python code.
By default, the connection to the ptvsd 3.x remote debug server is secured only by the secret and all data is passed in plain text. For a more secure connection, ptvsd 3.x supports SSL using the tcsp protocol, which you set up as follows:
- On the remote computer, generate separate self-signed certificate and key files using openssl:
openssl req -new -x509 -days 365 -nodes -out cert.cer -keyout cert.key ptvsd.enable_attach(secret='my_secret', certfile='cert.cer', keyfile='cert.key') You can also make the same change in the code file on the local computer, but because this code isn’t actually run, it isn’t strictly necessary.
- Copy the certificate file from the remote computer to the local computer.
- Open Control Panel and navigate to Administrative Tools >Manage computer certificates.
- In the window that appears, expand Trusted Root Certification Authorities on the left side, right-click Certificates, and select All Tasks >Import.
- Navigate to and select the .cer file copied from the remote computer, then click through the dialogs to complete the import.
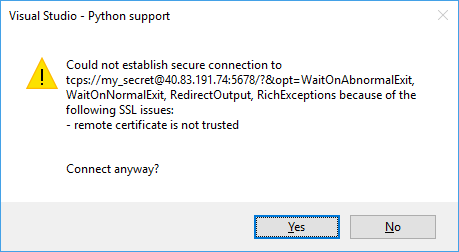
- If you see the remote certificate is not trusted warning below, it means you did not properly add the certificate to the Trusted Root CA. Check those steps and try again.
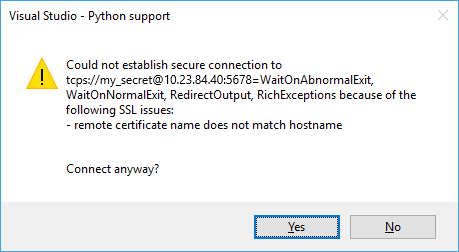
- If you see the remote certificate name does not match hostname warning below, it means you did not use the proper hostname or IP address as the Common Name when creating the certificate.
Feedback
Submit and view feedback for