- High context switch and interrupt rates: How to diagnose and fix in Linux
- What is context switching?
- What is the interrupt rate?
- Checking context switch and interrupt rates in your system
- vmstat
- pidstat
- cperf
- Troubleshooting a high context switching issue
- Identifying the root cause
- Resolving high context switch rate problems
- Conclusion
- Context Switching
High context switch and interrupt rates: How to diagnose and fix in Linux
How can multiple processes, such as video players or Google Chrome, run simultaneously on a single core computer? The answer is a mechanism called context switching that enables the operating system to multitask and allow multiple processes to share a single CPU.
However, context switching can affect system performance. To diagnose and fix high context switch and interrupt rates in Linux, we should first understand these terms and how they can affect your system.
What is context switching?
Context switching is the process of storing the current state of the CPU in the process control block (a data structure managed by Linux) for the task it’s working on so that this saved state can be reloaded each time that task is resumed. Context switches make it possible for multiple processes to share a single CPU, and as such, they’re part of the essential functionality of a multitasking operating system.
What is the interrupt rate?
The interrupt rate is the number of interrupts occurring over time in the Linux server. The higher the interrupt rate, the greater its impact on system performance.
Checking context switch and interrupt rates in your system
It can be hard to tell whether a high context switch and interrupt rate is behind your production server woes, partly because of the sheer number of other potential culprits. Fortunately, we have several tools we can use to check the number of context switches and interrupt rates in Linux: vmstat, pidstat, and perf.
vmstat
Let’s start with vmstat, a built-in command line tool that collects information about memory, system processes, paging, interrupts, I/O, or CPU scheduling. For example, we can use it to check for the monitoring metrics of our system, with an interval time of 5 seconds, and only capturing 10 times:
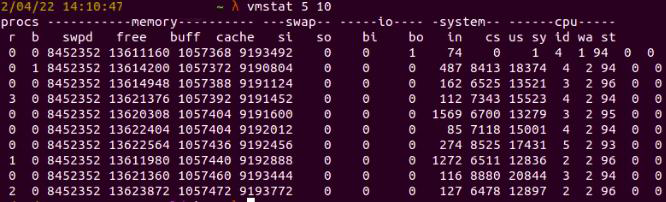
Fig. 1: vmstat results for interval 5 secs and 10 times
Here, the data memory is in kilobytes (KB), and the CPU usage is given in percentage.
Alternatively, if we want to display the active and inactive memory of our system in megabytes, we can use
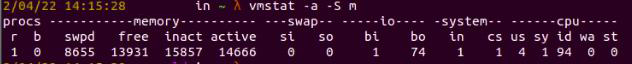
Fig. 2: vmstat shows the active and inactive memory in megabytes
pidstat
System administrators often use the pidstat tool to monitor tasks currently managed by the Linux kernel.
For example, to show all tasks, we can run
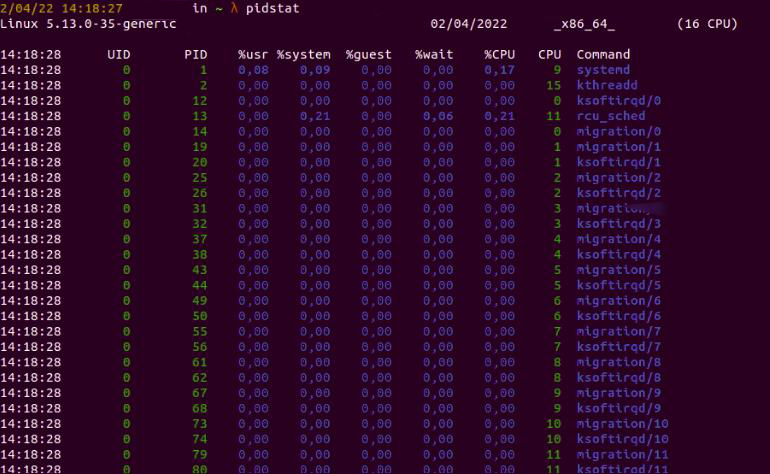
Fig. 3: Results for the pidstat command
If we only want to display statistics about the Postgres database process, we can run
Fig 4: pidstat displaying the Postgres process
Alternatively, we might want to get the statistics about a process by its ID:
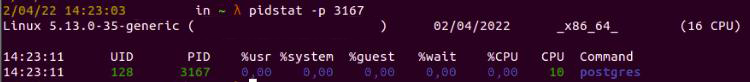
Fig. 5: pidstat shows statistics about a specific process ID
cperf
The perf command shows combinations of performance counters, such as performance metrics. In addition, it can inject small scripts into the kernel to process this data in real time.
In order to install perf, we need to install Linux tools first.
sudo apt-get install linux-tools-common linux-tools-generic linux-tools-`uname -r
Then we can get counter statistics for the entire system for five seconds by using the perf command.
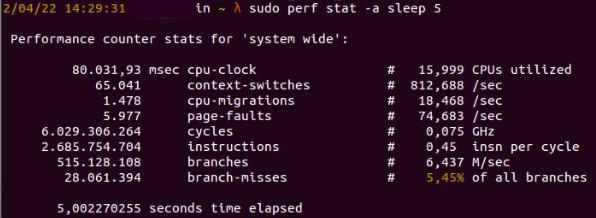
Fig. 6: The perf command shows statistic for 5 seconds
We can also profile a certain process by its ID for 10 seconds, at 99 hertz. Sampling at a higher frequency (like 999 or 9999) will produce a lot of overhead results. In addition, sampling at an odd number rate (like 99 instead of 100) will prevent lockstep sampling issues (profiling samples at the same frequency and getting incorrect sampling results).
sudo perf record -F 99 -p PID sleep 10

Fig. 7: perf shows data filtered by frequency
Troubleshooting a high context switching issue
For a more in-depth demonstration, we’ll use a dummy application in the Go programming language—one that has a high context switch rate problem.
The application will read data from a csv file. The csv file contains data for datetime of past_date and future_date, for example, “2006-12-28” and “2030-03-23.”
Here’s the content of the time.csv as below:
past_date,future_date
2006-12-28,2030-03-23
2001-11-20,2026-10-30
2006-12-28,2035-03-23
2004-11-20,2024-01-30
2003-12-28,2035-03-23
2002-11-20,2024-08-30
2005-12-28,2033-03-23
2005-07-20,2051-01-30
The application code is implemented as:
package main
import (
"encoding/csv"
"fmt"
"log"
"os"
"sync"
"time"
)

func f(from string)
var wg sync.WaitGroup
sliceLength := 1000000
wg.Add(sliceLength)
for i := 0; i < sliceLength; i++ records := readCsvFile("time.csv")

go func(i int) defer wg.Done()
for _, record := range records layout := "2006-01-02"
past_date, _ := time.Parse(layout, record[0])
future_date, _ := time.Parse(layout, record[1])
past_date.Date()
future_date.Date()

>
>(i)
>
wg.Wait()

>

func readCsvFile(filePath string) [][]string f, err := os.Open(filePath)
if err != nil <
log.Fatal("Unable to read input file "+filePath, err)
>
defer f.Close()

csvReader := csv.NewReader(f)
records, err := csvReader.ReadAll()
if err != nil <
log.Fatal("Unable to parse file as CSV for "+filePath, err)
>

return records
>
func main() <
f("direct")
fmt.Println("done")
>
Before we check for performance issues in our application, we should first close any running processes in the server that we don’t need so that the performance monitoring process will be more efficient.
To trigger the application, we’ll start by running this command:
Next, we’ll check the context switch rate by running vmstat. (Since vmstat is a lightweight command, we can be confident that performance monitoring will not be affected by running it.)
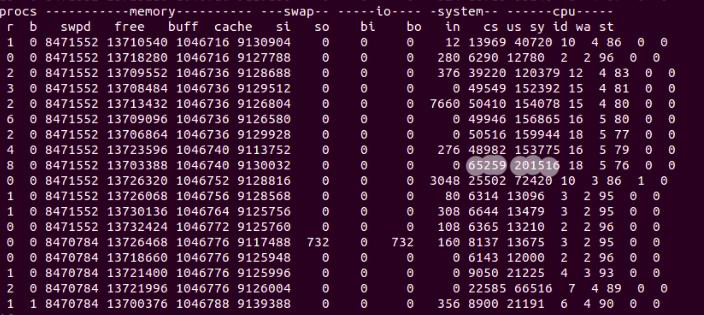
Fig. 8: vmstat showing performance monitoring metrics
In figure 8, we have various column headers, such as cs, us, sy, id, wa, and st. These stand for the number of system interrupts (in), context switches (cs), percentage of cpu time on non-kernel processes (us), percentage of cpu time on kernel processes (sy), percentage of idle CPU time (id), percentage of time spent on waiting for input/output (wa), and percentage of time stolen by virtual machine (st).
We’re looking at 201,516 context switches, and the interrupt rate is 65,259. These unusual numbers point to a related performance issue in our application.
Identifying the root cause
If we take a closer look at our code, we’ll see that we’re using goroutine to have the application run faster. However, due to the nature of the application—it only retrieves data from a small csv file—we don’t need to take the concurrency approach with goroutines. In fact, this concurrency approach is the root cause of our high context switch rate.
When iterating the for loop in goroutine, the main goroutine will have to check for existing iterators in other routines so that we only loop in 1,000,000 times.
for i := 0; i < sliceLength; i++ <
records := readCsvFile("time.csv")

go func(i int) <
defer wg.Done()
for _, record := range records <
layout := "2006-01-02"
past_date, _ := time.Parse(layout, record[0])
future_date, _ := time.Parse(layout, record[1])
past_date.Date()
future_date.Date()

>
>(i)

>
wg.Wait()

>
As a result, the main goroutine will need to check in different goroutines continuously, and this will lead to increased context switching.
Resolving high context switch rate problems
This issue can be solved by removing goroutines. Instead of using multiple goroutines, we will only execute the loop in one main routine.
package main

import (
"encoding/csv"
"fmt"
"log"
"os"
"time"
)

func f(from string) <
sliceLength := 1000000
for i := 0; i < sliceLength; i++ <
records := readCsvFile("time.csv")
for _, record := range records <
layout := "2006-01-02"
past_date, _ := time.Parse(layout,record[0])
future_date, _ := time.Parse(layout,record[1])
past_date.Date()
future_date.Date()
>
>
>

func readCsvFile(filePath string) [][]string <
f, err := os.Open(filePath)
if err != nil <
log.Fatal("Unable to read input file "+filePath, err)
>
defer f.Close()

csvReader := csv.NewReader(f)
records, err := csvReader.ReadAll()
if err != nil <
log.Fatal("Unable to parse file as CSV for "+filePath, err)
>

return records
>
func main() f("direct")
fmt.Println("done")
>
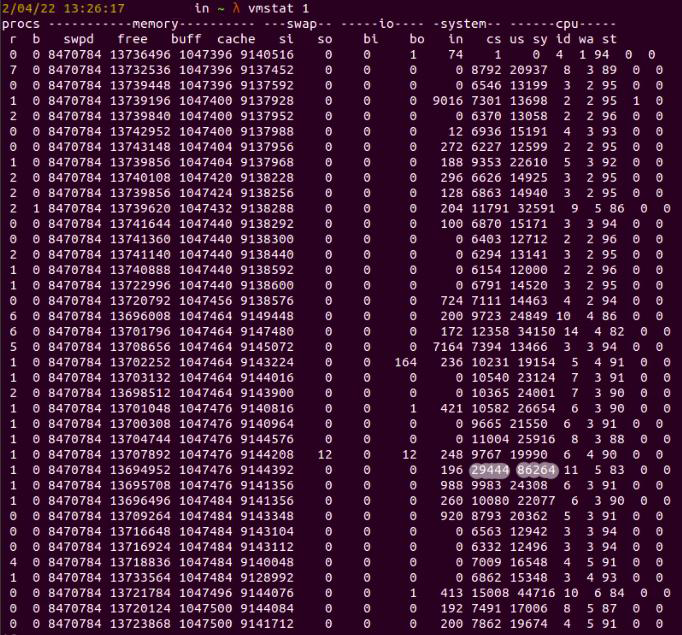
Fig. 9: Context switching is now reduced
Conclusion
There could be many reasons behind high context switch and interrupt rates in Linux. Regardless of the root cause, increased context switching is a sure sign that our system is having performance issues that we should immediately update.
This might not be an easy task at first, since it requires knowledge of how a Linux server works as well as how applications are implemented in Linux. Now that you understand high context switching and interrupt rates in Linux servers, and after learning the steps to take to address the issue, you’ll be able to troubleshoot with confidence.
Context Switching
Once the kernel has selected a new process, the technical details associated with multitasking must be dealt with; these details are known collectively as context switching. The auxiliary function context_switch is the dispatcher for the required architecture-specific methods.
kernel/sched.c static inline void context_switch(struct rq *rq, struct task_struct *prev, struct task_struct *next)
prepare_task_switch(rq, prev, next);
Immediately before a task switch, the prepare_arch_switch hook that must be defined by every architecture is called from prepare_task_switch. This enables the kernel to execute architecture-specific code to prepare for the switch. Most supported architectures (with the exception of Sparc64 and Sparc) do not use this option because it is not needed.
The context switch proper is performed by invoking two processor-specific functions:
1. switch_mm changes the memory context described in task_struct->mm. Depending on the processor, this is done by loading the page tables, flushing the translation lookaside buffers (partially or fully), and supplying the MMU with new information. Because these actions go deep into CPU details, I do not intend to discuss their implementation here.
2. switch_to switches the processor register contents and the kernel stack (the virtual user address space is changed in the first step, and as it includes the user mode stack, it is not necessary to change the latter explicitly). This task also varies greatly from architecture to architecture and is usually coded entirely in assembly language. Again, I ignore implementation details.
Because the register contents of the userspace process are saved on the kernel stack when kernel mode is entered (see Chapter 14 for details), this need not be done explicitly during the context switch. And because each process first begins to execute in kernel mode (at that point during scheduling at which control is passed to the new process), the register contents are automatically restored using the values on the kernel stack when a return is made to userspace.
Remember, however, that kernel threads do not have their own userspace memory context and execute on top of the address space of a random task; their task_struct->mm is null. The address space »borrowed» from the current task is noted in active_mm instead:
next->active_mm = oldmm; atomic_inc(&oldmm->mm_count); enter_lazy_tlb(oldmm, next);
enter_lazy_tlb notifies the underlying architecture that exchanging the userspace portion of the virtual address space is not required. This speeds up the context switch and is known as the lazy TLB technique.
If the previous task was a kernel thread (i.e., prev->mm is null), its active_mm pointer must be reset to null to disconnect it from the borrowed address space:
Finally, the task switch is finished with switch_to, which switches the register state and the stack — the new process will be running after the call:
/* Here we just switch the register state and the stack. */
* this_rq must be evaluated again because prev may have moved
* CPUs since it called schedule(), thus the ‘rq’ on its stack
The code following after switch_to will only be executed when the current process is selected to run next time. finish_task_switch performs some cleanups and allows for correctly releasing locks, which, however, we will not discuss in detail. It also gives individual architectures another possibility to hook into the context switching process, but this is only required on a few machines. The barrier statement is a directive for the compiler that ensures that the order in which the switch_to and finish_task_switch statements are executed is not changed by any unfortunate optimizations (see Chapter 5 for more details).
The interesting thing about finish_task_switch is that the cleanups are performed for the task that has been active before the running task has been selected for execution. Notice that this is not the task that has initiated the context switch, but some random other task in the system! The kernel must find a way to communicate this task to the context_switch routine, and this is achieved with the switch_to macro. It must be implemented by every architecture and has a very unusual calling convention: Two variables are handed over, but in three parameters! This is because not only two, but three processes are involved in a context switch. The situation is illustrated in Figure 2-16.
Kernel mode next = B stack prev = A