MTR – A Network Diagnostic Tool for Linux
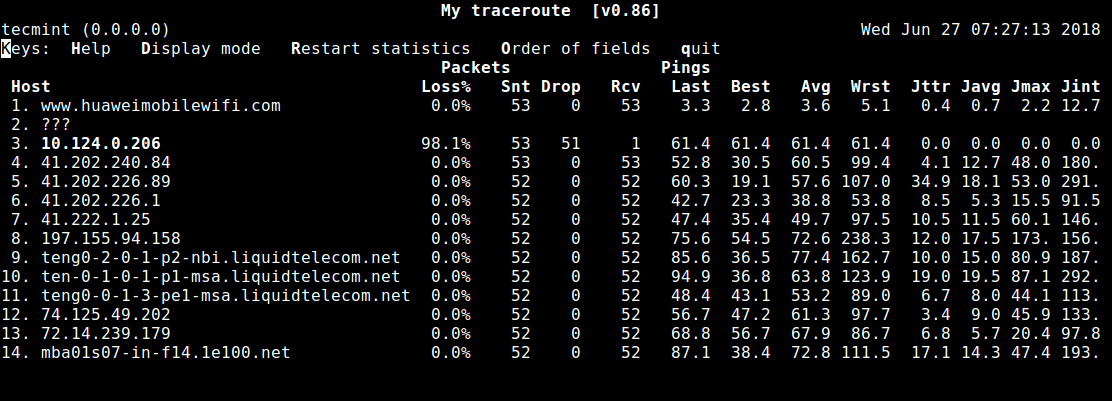
MTR is a simple, cross-platform command-line network diagnostic tool that combines the functionality of commonly used traceroute and ping programs into a single tool. In a similar fashion as traceroute, mtr prints information about the route that packets take from the host on which mtr is run to a user specified destination host.
However, mtr shows a wealth of information than traceroute: it determines the pathway to a remote machine while printing response percentage as well as response times of all network hops in the internet route between the local system and a remote machines.
How Does MTR Work?
Once you run mtr, it probes the network connection between the local system and a remote host that you have specified. It first establishes the address of each network hop (bridges, routers and gateways etc.) between the hosts, it then pings (sends a sequence ICMP ECHO requests to) each one to determine the quality of the link to each machine.
During the course of this operation, mtr outputs some useful statistics about each machine – updated in real-time, by default.
This tool comes pre-installed on most Linux distributions and is fairly easy to use once you go through the 10 mtr command examples for network diagnostics in Linux, explained below.
If mtr not installed, you can install it on your respective Linux distributions using your default package manager as shown.
$ sudo apt install mtr $ sudo yum install mtr $ sudo dnf install mtr
10 MTR Network Diagnostics Tool Usage Examples
1. The simplest example of using mtr is to provide the domain name or IP address of the remote machine as an argument, for example google.com or 216.58.223.78. This command will show you a traceroute report updated in real-time, until you exit the program (by pressing q or Ctrl + C ).
$ mtr google.com OR $ mtr 216.58.223.78 Start: Thu Jun 28 12:10:13 2018 HOST: TecMint Loss% Snt Last Avg Best Wrst StDev 1.|-- 192.168.0.1 0.0% 5 0.3 0.3 0.3 0.4 0.0 2.|-- 5.5.5.211 0.0% 5 0.7 0.9 0.7 1.3 0.0 3.|-- 209.snat-111-91-120.hns.n 80.0% 5 7.1 7.1 7.1 7.1 0.0 4.|-- 72.14.194.226 0.0% 5 1.9 2.9 1.9 4.4 1.1 5.|-- 108.170.248.161 0.0% 5 2.9 3.5 2.0 4.3 0.7 6.|-- 216.239.62.237 0.0% 5 3.0 6.2 2.9 18.3 6.7 7.|-- bom05s12-in-f14.1e100.net 0.0% 5 2.1 2.4 2.0 3.8 0.5
2. You can force mtr to display numeric IP addresses instead of host names (typically FQDNs – Fully Qualified Domain Names), using the -n flag as shown.
$ mtr -n google.com Start: Thu Jun 28 12:12:58 2018 HOST: TecMint Loss% Snt Last Avg Best Wrst StDev 1.|-- 192.168.0.1 0.0% 5 0.3 0.3 0.3 0.4 0.0 2.|-- 5.5.5.211 0.0% 5 0.9 0.9 0.8 1.1 0.0 3.|-- . 100.0 5 0.0 0.0 0.0 0.0 0.0 4.|-- 72.14.194.226 0.0% 5 2.0 2.0 1.9 2.0 0.0 5.|-- 108.170.248.161 0.0% 5 2.3 2.3 2.2 2.4 0.0 6.|-- 216.239.62.237 0.0% 5 3.0 3.2 3.0 3.3 0.0 7.|-- 172.217.160.174 0.0% 5 3.7 3.6 2.0 5.3 1.4
3. If you would like mtr to display both host names as well as numeric IP numbers use the -b flag as shown.
$ mtr -b google.com Start: Thu Jun 28 12:14:36 2018 HOST: TecMint Loss% Snt Last Avg Best Wrst StDev 1.|-- 192.168.0.1 0.0% 5 0.3 0.3 0.3 0.4 0.0 2.|-- 5.5.5.211 0.0% 5 0.7 0.8 0.6 1.0 0.0 3.|-- 209.snat-111-91-120.hns.n 0.0% 5 1.4 1.6 1.3 2.1 0.0 4.|-- 72.14.194.226 0.0% 5 1.8 2.1 1.8 2.6 0.0 5.|-- 108.170.248.209 0.0% 5 2.0 1.9 1.8 2.0 0.0 6.|-- 216.239.56.115 0.0% 5 2.4 2.7 2.4 2.9 0.0 7.|-- bom07s15-in-f14.1e100.net 0.0% 5 3.7 2.2 1.7 3.7 0.9
4. To limit the number of pings to a specific value and exit mtr after those pings, use the -c flag. If you observe from the Snt column, once the specified number of pings is reached, the live update stops and the program exits.
$ mtr -c5 google.com
5. You can set it into report mode using the -r flag, a useful option for producing statistics concerning network quality. You can use this option together with the -c option to specify the number of pings. Since the statistics are printed to std output, you can redirect them to a file for later analysis.
$ mtr -r -c 5 google.com >mtr-report
The -w flag enables wide report mode for a clearer output.
$ mtr -rw -c 5 google.com >mtr-report
6. You can also re-arrange the output fields the way you wish, this is made possible by the -o flag as shown (see the mtr man page for meaning of field labels).
$ mtr -o "LSDR NBAW JMXI" 216.58.223.78
7. The default interval between ICMP ECHO requests is one second, you can specify interval between ICMP ECHO requests by changing the value using the -i flag as shown.
8. You can use TCP SYN packets or UDP datagrams instead of the default ICMP ECHO requests as shown.
$ mtr --tcp test.com OR $ mtr --udp test.com
9. To specify the maximum number of hops (default is 30) to be probed between the local system and the remote machine, use the -m flag.
10. While probing network quality, you can set the packet size used in bytes using the -s flag like so.
$ mtr -r -s PACKETSIZE -c 5 google.com >mtr-report
With these examples, you should be good to go with using mtr, see man page for more usage options.
Also check out these useful guides about Linux network configurations and troubleshooting:
That’s it for now! MTR is a simple, easy-to-use and above all cross-platform network diagnostics tool. In this guide, we have explained 10 mtr command examples in Linux. If you have any questions, or thoughts to share with us, use the comment form below.
How to Perform a MTR in Windows, Mac OS, and Linux
Sometimes, speed and connectivity problems can be related to latency or a ‘bad hop’ on the route to the server to which you are connecting, or the site you’re attempting to visit. There are a number of ways to determine what the cause of this is, but one great place to start is
An MTR test is a diagnostic tool that can help identify where connections on the internet are failing and may identify what’s causing your connection to fail. Please ensure you run the test while using the specific network that is having an issue.
How to Perform an MTR On Windows
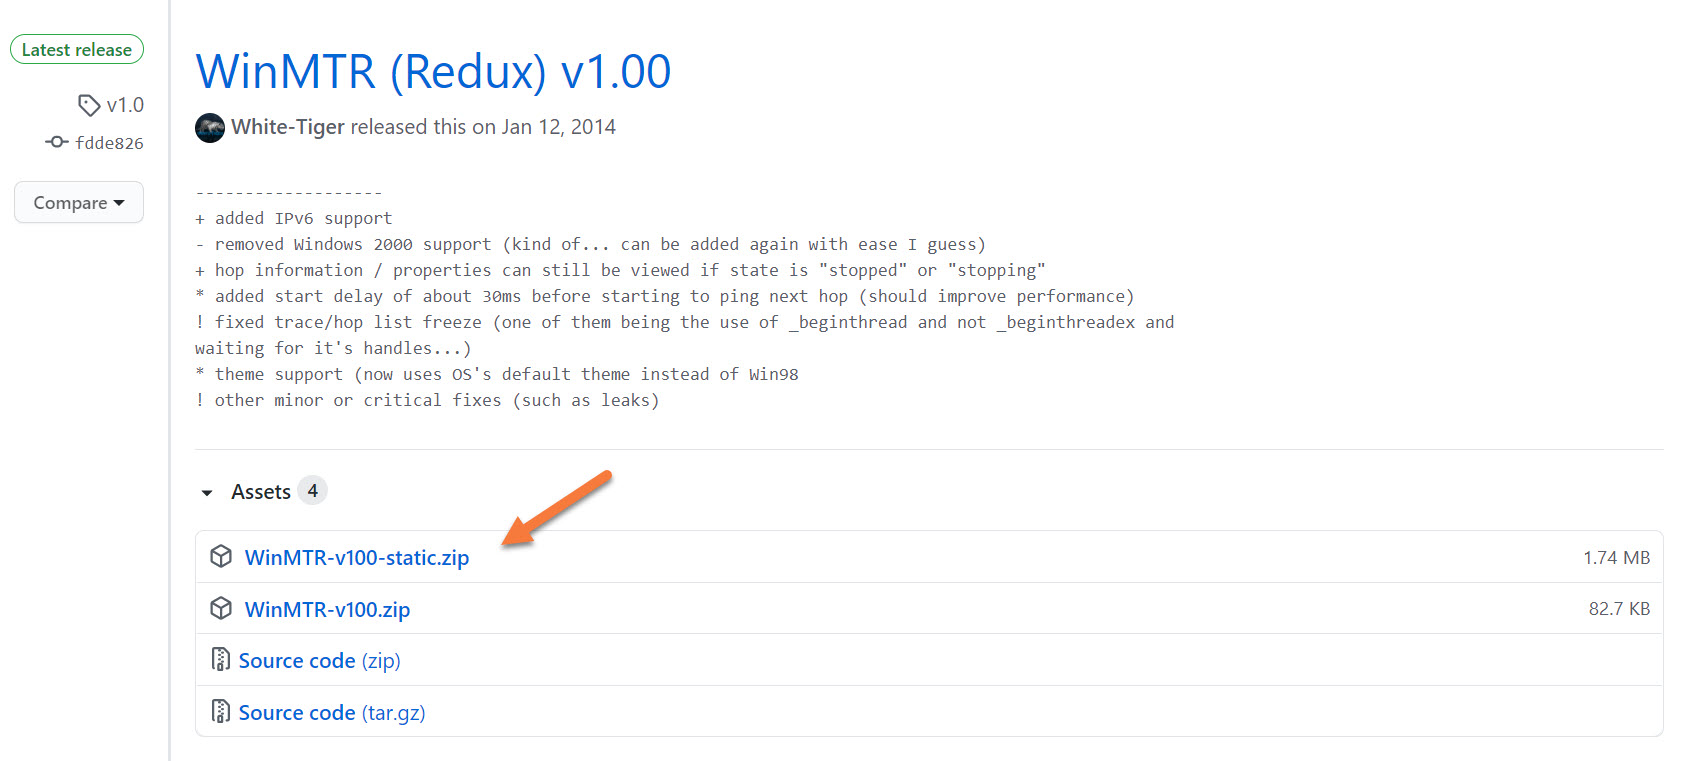
Step 1: Download WinMTR. If you Google WinMTR download, there are a lot of sites that have the file, but some may be sketchy or give you malware. To prevent that, you can click this link to open a safe place to download the latest build of WinMTR.
On that page, you’ll want to download the file that ends in ‘static’. The version may change, but the static one is the one you want. See below:
After the file downloads, navigate to the folder where it was saved and unzip the file.
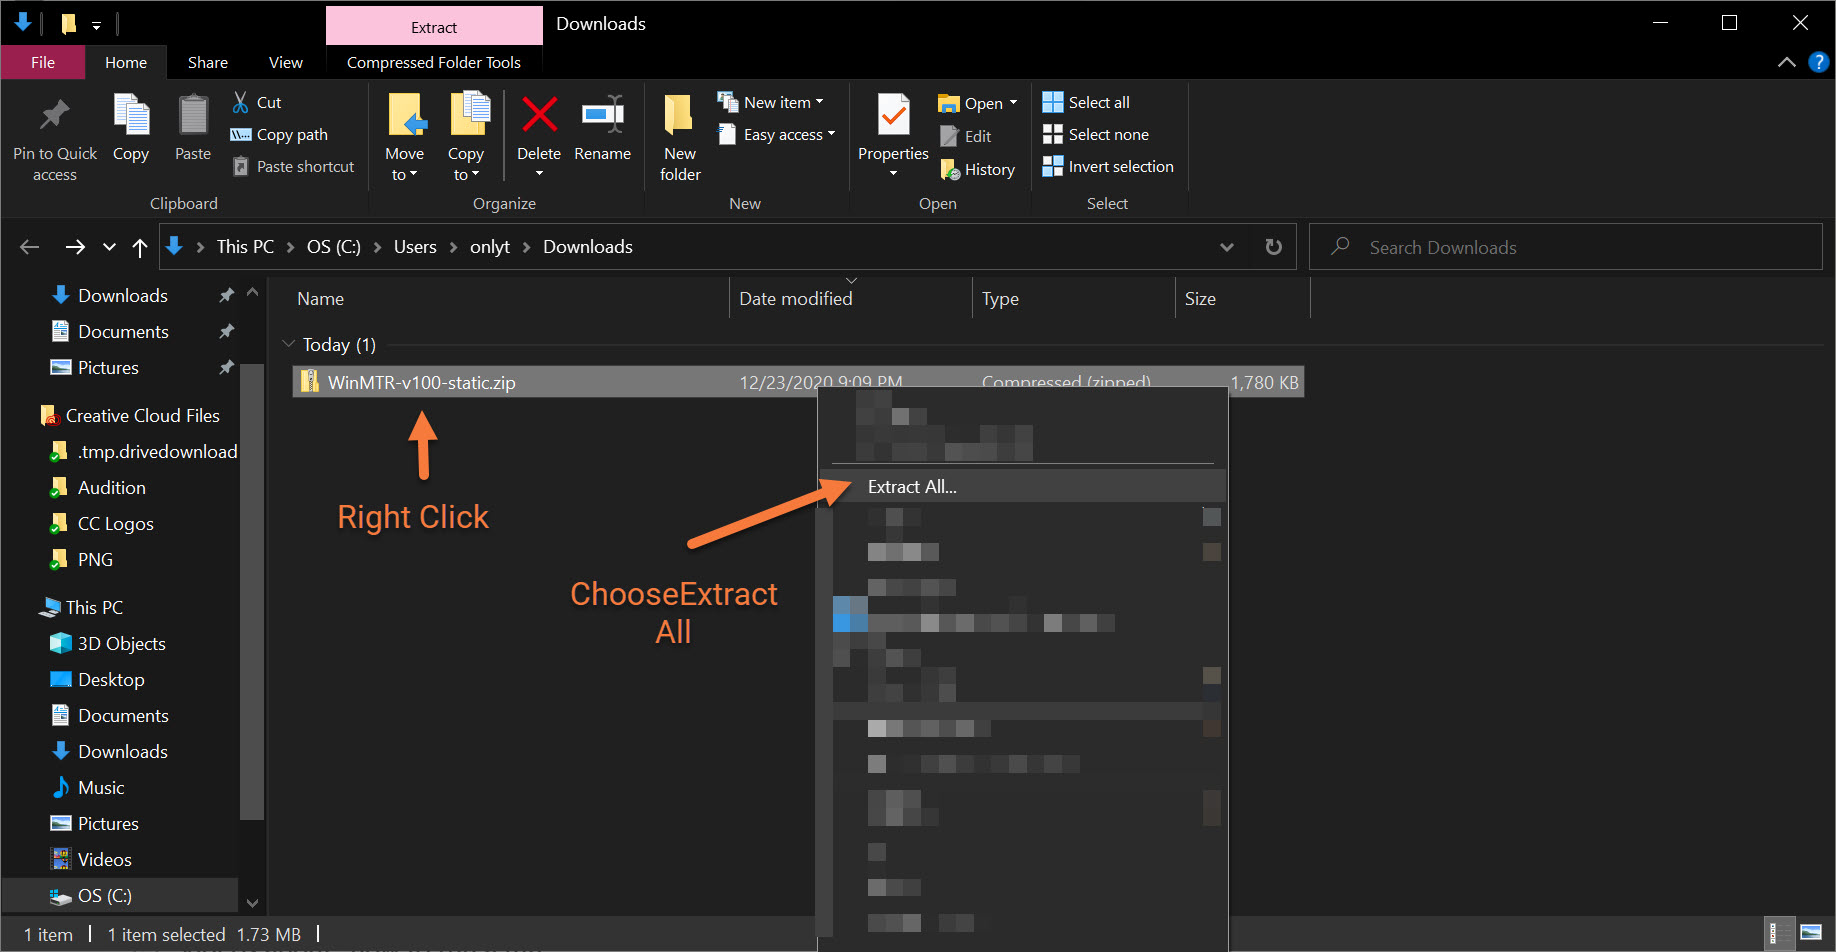
Next, click “Extract” to extract the files into the same folder where the WinMTR ZIP was saved.
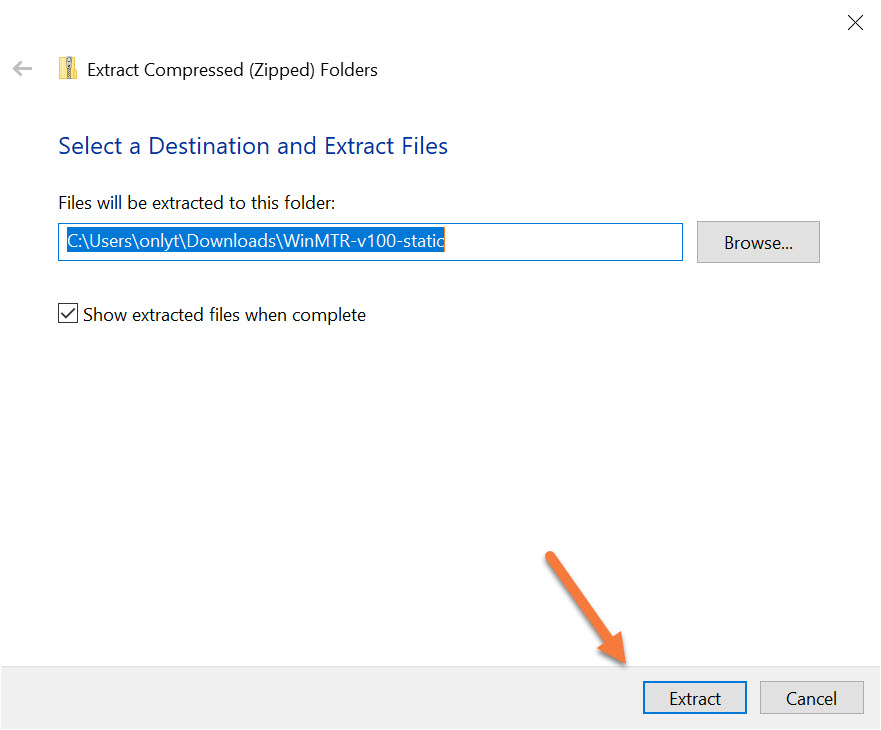
After extracting the files, a new window will open with the files.
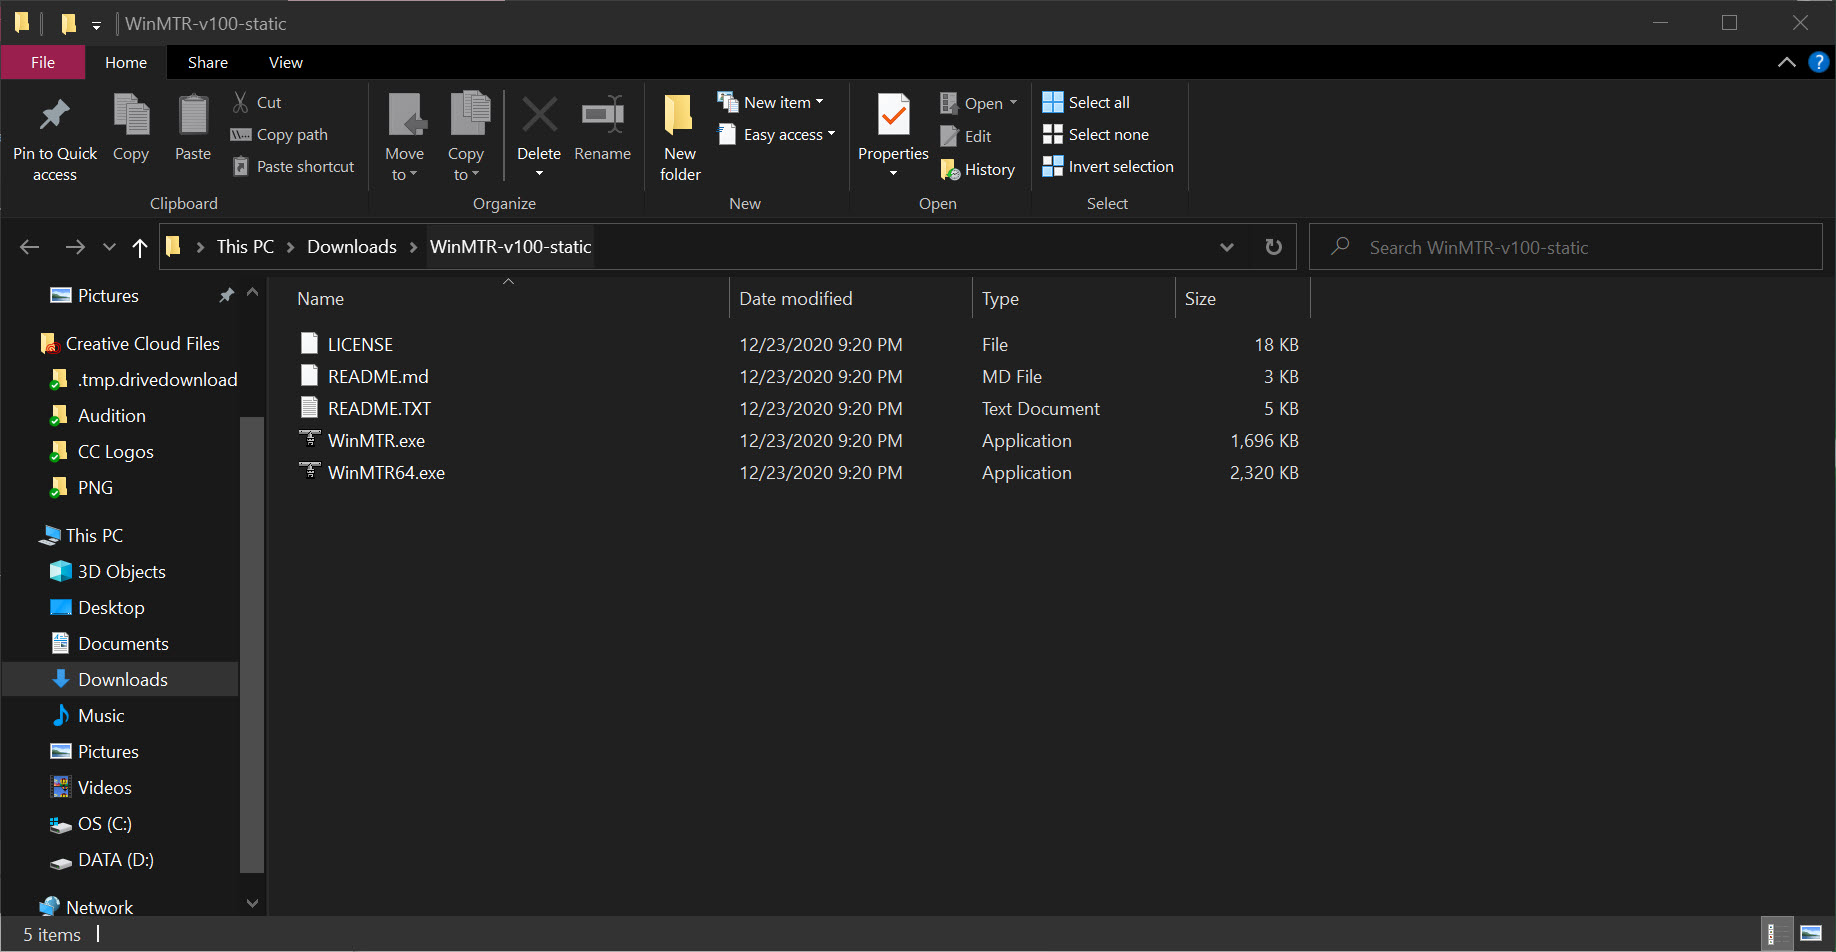
Double click WinMTR64.exe to open the application.
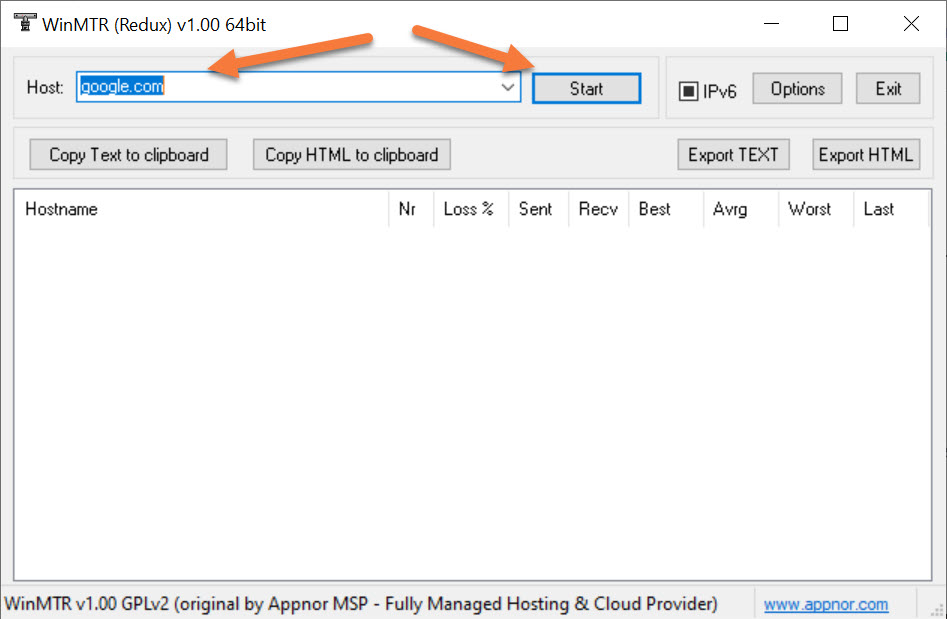
Step 2: Run your MTR Test. To do this, enter a domain name or IP address in the host box, then click Start.
Step 3: It’s best to let an MTR test run for about 15 minutes or so to accrue a good dataset.
Once you’re ready to stop the test, click Stop.

Now you can see the results of your MTR Test.
Step 4: It’s more than likely that our team asked you to run this test and are awaiting an export of the results. To do this, click Export Text. (Yes, you can export as HTML but TXT files are much smaller and easier to work with via attachments).

After clicking export, you’ll be given the option to name the file. You can give it any name you want at this point.
That’s it! Now you have created an MTR report on Windows, exported it as a TXT file, and are able to send us the file for examination.
How to Perform an MTR On Linux
Installing MTR on Linux is pretty easy. You’ll just need to use the terminal to download the package from it’s repository and install.
If you’re running a RHEL based distrol, such as CentOS, Fedora, or RHEL, open your terminal and enter:
After it’s been installed, enter this command to run the test:
Note, if your user on the Linux system does not have sufficient permissions, you can use the command below. You’ll need to enter your root or admin user password to run this, however.
If you’re running a Debian based distro, like Ubuntu, use the instructions below:
Open your terminal and enter:
Note, if your user on the Linux system does not have sufficient permissions, you can use the command below. You’ll need to enter your root or admin user password to run this, however.
After it’s been installed, enter this command to run the test:
Since the MTR text runs in a terminal, you can select the text in the terminal, right-click on it, select copy, then paste the results in a ticket to our support team, should you have been requested to run an MTR Test.
Tired of experiencing issues with connectivity to your site? Get the best and fastest hosting support with ChemiCloud! 🤓 Check out our web hosting plans!
How to Perform an MTR On MacOS
The MTR tool does not come pre-installed on Mac OS X devices and is not available in the Apple store. To be able to install MTR, you will need to have the Homebrew package management system installed on your computer. Homebrew makes libraries and utilities available for your Mac that are not included in the Mac OS X installation by default.
Installing MTR
/usr/bin/ruby -e "$(curl -fsSL https://raw.githubusercontent.com/Homebrew/install/master/install)"
cd /usr/local/Cellar/mtr/0.94/sbin
Running MTR
Once MTR is installed, open your Terminal app and run this command:
Let the MTR trace run for 10-15 minutes. Since the MTR text runs in a terminal, you can select the text in the terminal, right-click on it, select copy (or Press Command-C to copy), then paste the results in a ticket to our support team, should you have been requested to run an MTR Test. Use your mouse to highlight the traces results.
And that’s it! Now you know how to run an MTR test and send our Support team the results!
We hope you enjoyed this tutorial!