WiFi Heat Maps Explained in Plain Language
WiFi heat maps can help you find one of the most valued treasures in today’s digital world: a strong WiFi signal. In this article, we explain what they are and how you can create them on macOS, Windows, and other platforms using NetSpot WiFi heatmap software.
Creating WiFi heatmaps may seem complicated at first, especially if this is your first time reading about them, but the reality is that modern WiFi heat mapping software makes it easy.
What Is a WiFi Heatmap?
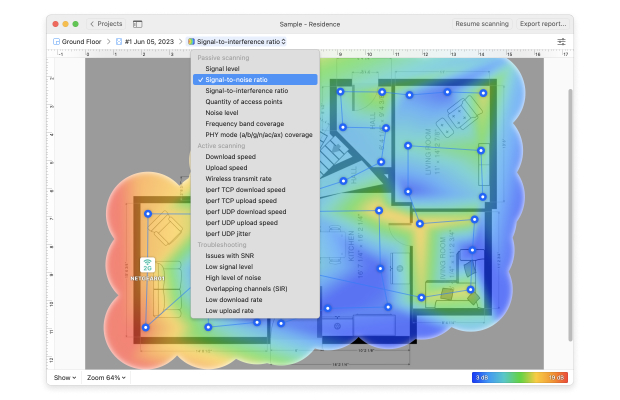
A WiFi heatmap is a visual representation of wireless signal distribution, typically showing signal strength using a color-coded approach, with the color green representing areas with a strong signal and the color red representing areas with a weak signal.
WiFi heatmaps can show wireless signal strength and other parameters across an entire area all at once
Because WiFi heatmaps can show wireless signal strength and other parameters across an entire area all at once, they make troubleshooting of various WiFi issues, such as connection drops, high latency, and data transfer speed fluctuations much easier than static measurements taken from a single place.
Besides troubleshooting WiFi issues, WiFi heatmaps also come in handy when setting up a wireless router because they make it easy to see which specific areas have a strong signal and which don’t, helping you determine a more suitable place for your router and revealing potential sources of signal interference, such as walls, furniture, large appliances, and all kinds of wireless devices.
Introduction to WiFi Heat Map Tools
Long gone are the days when WiFi heat mapping was performed only by professionals. Thanks to WiFi heat mapping software — free and paid, anyone can create a detailed WiFi heatmap with minimal effort and without any expert knowledge or skills.
The only problem is that choosing the right WiFi heatmapper can be a challenge since there are so many seemingly suitable options available for all major operating systems, including macOS, Windows, iOS, and Android.
Some free WiFi heatmappers don’t limit their users in any way, while others make only certain features available for free, requiring a paid license or subscription to unlock the rest.
The best WiFi heatmappers go well beyond collecting information about signal strength, allowing you to:
- Locate your busiest and least occupied channels in the 2.4 and 5 GHz bands;
- Collect live Wi-Fi data from all surrounding networks;
- See channel info, transmit rate, vendor, security type, band, etc.;
- Customize signal level and noise charts;
- Save historical data per each AP for later review;
- And more…
These and other features make WiFi heatmappers indispensable tools that deserve a place in everyone’s digital toolbox.
WiFi Heat Map for Mac Software Apps
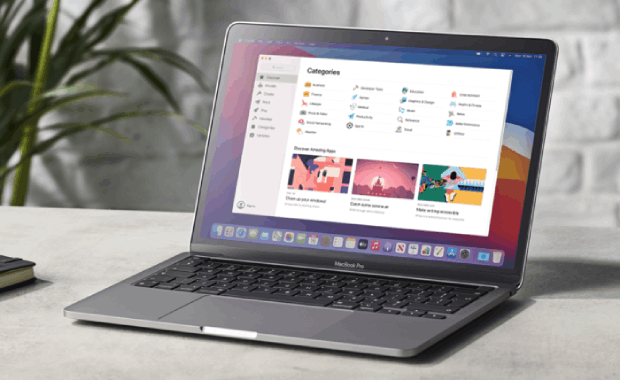
MacBooks are great WiFi analysis machines because of their strong signal reception, powerful performance, and many native WiFi heatmap for Mac apps.
WiFi heatmap Mac apps come in handy when dealing with slow download and upload speeds, high latency, connection drops, long page loading times, and other issues indicating problems with WiFi signal strength.
The best WiFi mapping Mac software can help inexperienced users accurately analyze any network and transform the gathered data into a color-coded heatmap.
When choosing a WiFi mapper Mac app, make sure that it’s compatible with your version of macOS. Even today, there are developers who have yet to introduce support for macOS Big Sur, leaving their customers usable to create WiFi heatmaps on their new Macs.
You should also read user reviews published in the Mac App Store to see how different WiFi heatmap for Mac solutions perform in real-life. Unfortunately, it’s way too easy for developers to make lofty promises without actually delivering on them.
Here are our top three tips for creating a WiFi heatmap on your Mac:
- Close all non-essential apps.
- Make sure your Mac is fully updated.
- Give your WiFi heatmapper for Mac all the privileges it requires.
These three simple tips can go a long way in ensuring accurate results.
WiFi Heatmap for Windows Tools
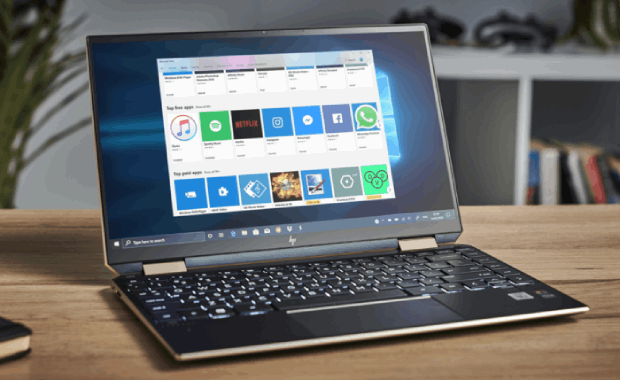
Windows users have many heatmapping tools to choose from, from simple utilities aimed at regular home users to highly sophisticated software costing thousands of dollars, whose primary audience are IT professionals.
When comparing different WiFi heatmap Windows software, you should keep in mind the same selection criteria as when comparing heatmappers for macOS, iOS, or Android. More specifically, you should avoid applications from unknown developers, especially if they’ve received a lot of negative reviews, and focus on software that’s known to deliver accurate results under all conditions.
Once you’ve narrowed down your list of options to just one top pick, you can go ahead and install it on your system. From there, the actual heatmapping process is the same as when using macOS heatmappers:
- Start a new wireless survey.
- Methodically take measurements of the entire surveyed area.
- Let your WiFi heatmap Windows software analyze the gathered data and turn them into a heatmap.
As long as you use a modern WiFi heatmapper, the whole process should take you just a short while.
WiFi Heat Map App for Android
Your Android device deserves more credit than it probably gets because it can do just about anything a much larger laptop can, including creating a WiFi heatmap. Here’s what you need:
If you’re reading this part of our comprehensive guide to WiFi heatmapping, then it’s likely that you already own at least one Android device, so you just need to install an Android WiFi heatmap app on it.
The Google Play Store is packed with many seemingly suitable options, but the reality is that creating WiFi heatmaps directly on Android devices is something not many apps can do. Some Android WiFi heatmappers, such as NetSpot, only collect wireless data, which is then analyzed on macOS or Windows and transformed into a colorful WiFi heatmap.
WiFi Heatmap iPhone Apps
Compared with macOS, Windows, and even Android, there’s a clear shortage of WiFi heatmap iOS apps. Why? Because Apple keeps its devices so restricted that developers can’t access the functionality they need to analyze wireless signals.
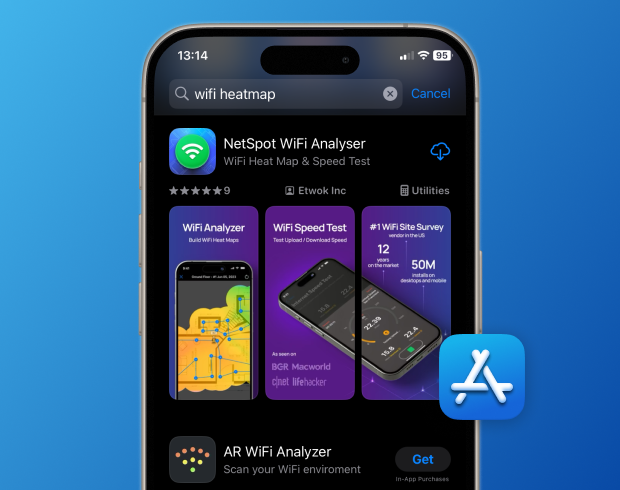
The good news is that some developers of WiFi heatmap iPhone apps, such as NetSpot, have managed to find their way around Apple’s restrictions by utilizing third-party spectrum analyzers like WiPry 2500x by Oscium, which can measure wireless activity on both 2.4 & 5 GHz.
This is How heatmapping on iOS works in a nutshell:
Download your iOS heatmapper of choice from the App Store.
Launch the download heat mapping app and, optionally, connect a third-party spectrum analyzer to your device.
Use the app to map out your area and analyze the results.
While certainly expensive, third-party spectrum analyzers deliver professional-grade accuracy in a sleek format, making them ideal for all network administrators and other demanding users who wouldn’t be satisfied with the results provided by the iPhone alone.
Selecting WiFi Heatmap Software
Regardless of if you choose a completely free WiFi heat mapping software application or paid one, you should always do your research and check if it meets at least the following three criteria:
- Delivers accurate results: Of course, you don’t want to use a WiFi heatmapper that delivers inaccurate results because then you couldn’t rely on its guidance when optimizing your wireless network.
- Is actively developed by a reputable company: It takes a lot of effort to develop a capable WiFi heat mapping solution, and it takes even more effort to provide ongoing support, updates, and bug fixes. That’s why you should always focus on WiFi heatmappers developed by reputable companies that stand behind their customers, especially if you intend to pay for one.
- Has plenty of positive online reviews: It’s easy for marketing departments to make lofty promises. So easy, in fact, that the products they’re promoting don’t always live up to them. The good news is that you can always rely on online reviews published by real users to tell you how things really are, so make sure to check them out.
Any WiFi heat map tool that meets these three selection criteria should be able to meet your needs without any issues.
One of the best WiFi heat map software solutions that deliver accurate results, are developed by a reputable company, and have plenty of positive online reviews is NetSpot, which is why we recommend it to all macOS, Windows, and Android users (the iOS version will introduce heatmapping capabilities in the near future with a free update).
Creating WiFi Heat Maps with NetSpot
NetSpot is an easy-to-use WiFi heat mapping tool with the capabilities and accuracy of professional-grade software. You can download it for free on any Mac or PC, and there’s also an Android version that delivers heatmapping capabilities in a convenient package (the iOS version will enable them soon).
The main thing that distinguishes NetSpot from other tools for creating heatmaps of WiFi networks is its impressive usability. Just take a look at how easy it is to visualize a WiFi network on a heatmap using NetSpot’s survey feature on a Mac or PC:
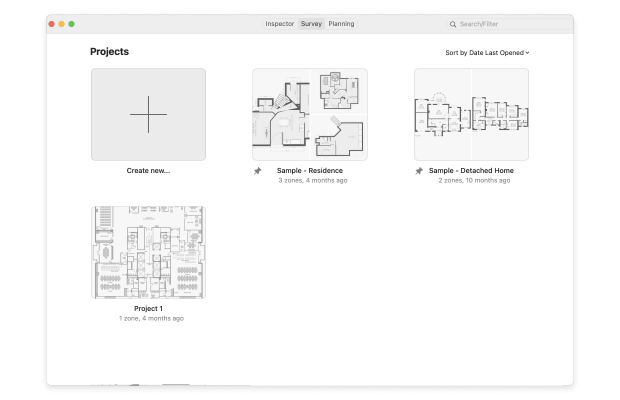
Launch NetSpot and switch to the Survey mode.
The Survey mode (available in a paid version only) is how NetSpot calls its heatmapping functionality. There’s also the so-called Discover mode, which lets you quickly collect a heap of information about all networks available in your area.
Click the “Start a new survey” button.
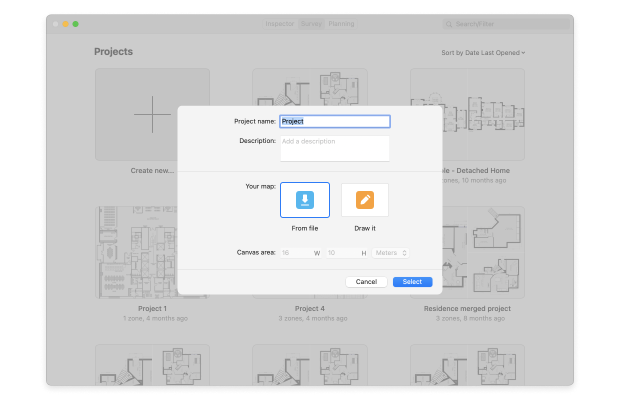
You will be asked to provide some information about the new project, including the Zone Area Type, which helps NetSpot configure default sampling settings. Don’t’ worry: NetSpot makes this very easy by clearly explaining all available options.
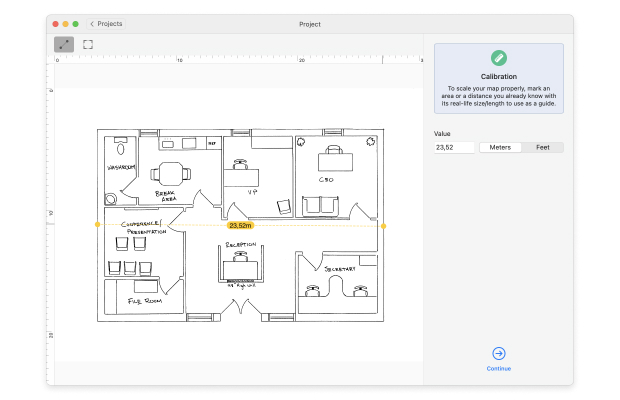
Upload or create a map of your area.
If you already have a map of the area you want to survey, then you can simply upload it. Alternatively, you can create one using the tools that come with NetSpot.
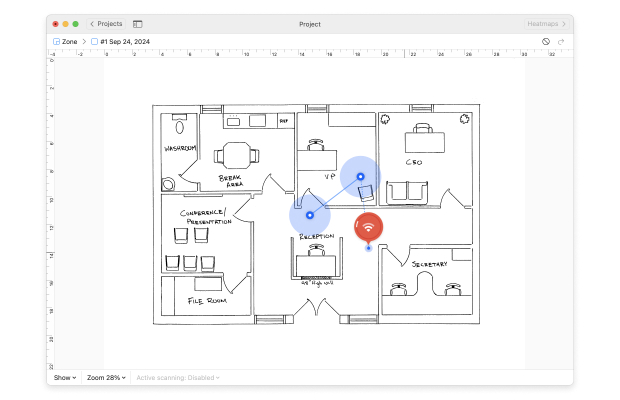
Click “Continue” and carry your device from one spot on the map to the next.
Your goal here is to cover the entire map with overlapping circles, which represent the places that have already been surveyed.
Click the “Stop scan” button and view the results.
By default, NetSpot shows the signal-to-noise ratio, but you can switch to other visualizations, including signal-to-interference ratio or frequency band coverage.
As you can see, creating WiFi heat maps with NetSpot is so straightforward that anyone with basic computer skills can do it and use the generated information to achieve better WiFi performance.
