- 1. Monitor Linux with Zabbix agent
- Install Zabbix agent
- Configure Zabbix for monitoring
- Passive checks
- Zabbix frontend
- Zabbix agent
- Active checks
- Zabbix frontend
- Zabbix agent
- View collected metrics
- Set up problem alerts
- Test your configuration
- Install Zabbix Agent on Ubuntu 20.04
- Step 1: Enable Zabbix repository on remote host
- Step 2: Install Zabbix agent
- Step 3: Configure Zabbix agent
- Step 4: Configure the firewall
- Step 5: Add host on Zabbix server
- Conclusion
1. Monitor Linux with Zabbix agent
This page walks you through the steps required to start basic monitoring of Linux machines with Zabbix. The steps described in this tutorial can be applied to any Linux-based operating system.
Who this guide is for
This guide is designed for new Zabbix users and contains the minimum set of steps required to enable basic monitoring of your Linux machine. If you are looking for deep customization options or require more advanced configuration, see Configuration section of Zabbix manual.
Prerequisites
Before proceeding with this installation guide, you must download and install Zabbix server and Zabbix frontend according to instructions for your OS.
Install Zabbix agent
Zabbix agent is the process responsible for gathering data.
Check your Zabbix server version:
Install Zabbix agent of the same version (recommended) on the Linux machine that you want to monitor. Based on your monitoring needs, it may be the same machine, where Zabbix server is installed, or a completely different machine.
Choose the most suitable installation method:
- Run as a Docker container — see the list of available images in Zabbix Docker repository.
- Install from Zabbix packages (available for Alma Linux, CentOS, Debian, Oracle Linux, Raspberry Pi OS, RHEL, Rocky Linux, SUSE Linux Enterprise Server, Ubuntu).
- Compile from sources.
Configure Zabbix for monitoring
Zabbix agent can collect metrics in active or passive mode (simultaneously).
A passive check is a simple data request. Zabbix server or proxy asks for some data (for example, CPU load) and Zabbix agent sends back the result to the server. Active checks require more complex processing. The agent must first retrieve from the server(s) a list of items for independent processing and then bulk send the data back. See Passive and active agent checks for more info.
Monitoring templates provided by Zabbix usually offer two alternatives — a template for Zabbix agent and a template for Zabbix agent (active). With the first option, the agent will collect metrics in passive mode. Such templates will deliver identical monitoring results, but using different communication protocols.
Further Zabbix configuration depends on whether you select a template for active or passive Zabbix agent checks.
Passive checks
Zabbix frontend
1. Log into Zabbix frontend.
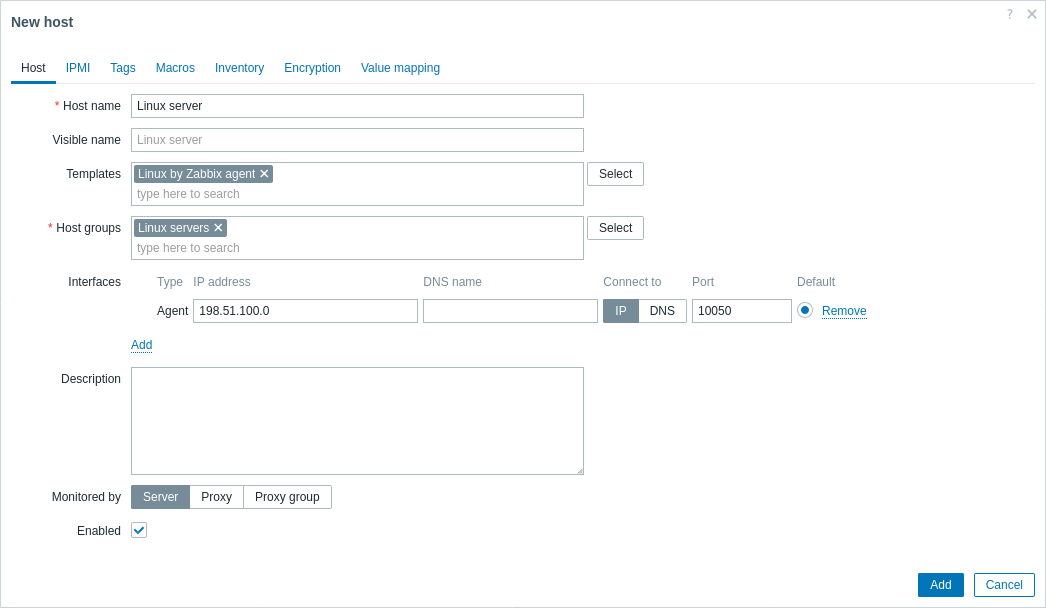
2. Create a host in Zabbix web interface.
This host will represent your Linux machine.
3. In the Interfaces parameter, add Agent interface and specify the IP address or DNS name of the Linux machine where the agent is installed.
4. In the Templates parameter, type or select Linux by Zabbix agent.
Zabbix agent
Open Zabbix agent configuration file (by default, the path is /usr/local/etc/zabbix_agentd.conf):
sudo vi /usr/local/etc/zabbix_agentd.confAdd the IP address or DNS name of your Zabbix server to the Server parameter.
Active checks
Zabbix frontend
1. Log in to Zabbix frontend.
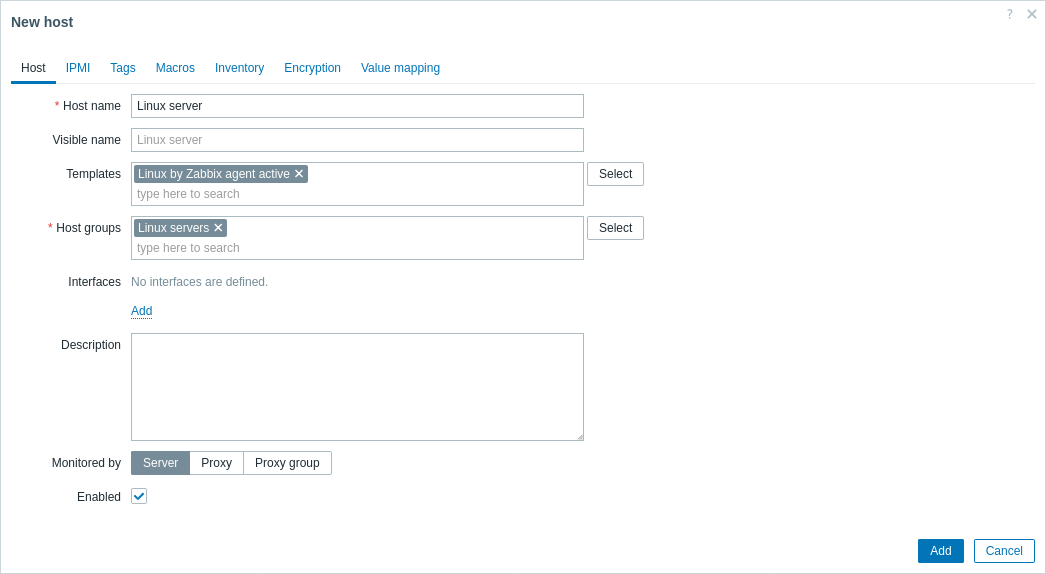
2. Create a host in Zabbix web interface.
This host will represent your Linux machine.
3. In the Templates parameter, type or select Linux by Zabbix agent active.
Zabbix agent
Open Zabbix agent configuration file (by default, the path is /usr/local/etc/zabbix_agentd.conf):
sudo vi /usr/local/etc/zabbix_agentd.conf- The name of the host you created in Zabbix web interface to the Hostname parameter.
- The IP address or DNS name of your Zabbix server to the ServerActive parameter.
ServerActive= 192.0.2.22 Hostname=Linux serverView collected metrics
Congratulations! At this point, Zabbix is already monitoring your Linux machine.
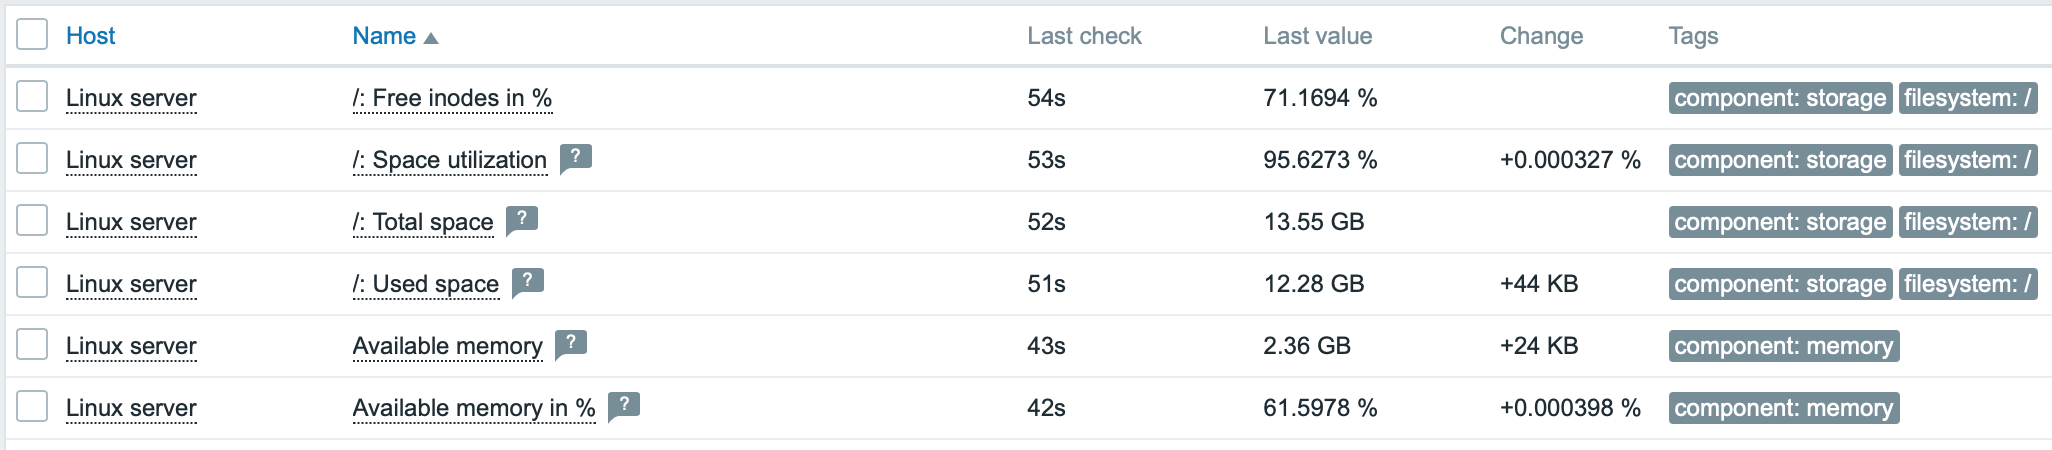
To view collected metrics, open the Monitoring->Hosts menu section and click on the Latest data next to the host.

This action will open a list of all the latest metrics collected from Linux server host.
Set up problem alerts
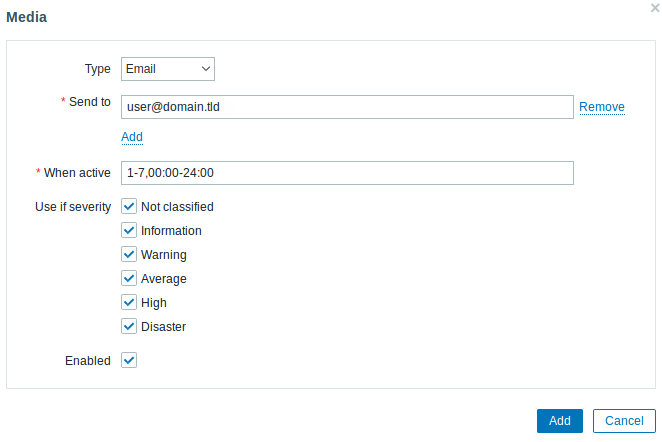
Zabbix can notify you about a problem with your infrastructure using a variety of methods. This guide provides configuration steps for sending email alerts.
1. Go to the User settings -> Profile, switch to the tab Media and add your email.
Next time, when Zabbix detects a problem you should receive an alert via email.
Test your configuration
On Linux, you can simulate high CPU load and as a result receive a problem alert by running:
You may need to run several md5sum processes for CPU load to exceed the threshold.
When Zabbix detects the problem, it will appear in the Monitoring->Problems section.

If the alerts are configured, you will also receive the problem notification.
- Creating an item — how to start monitoring additional metrics (custom monitoring without templates).
- Zabbix agent items, Zabbix agent items for Windows — full list of metrics you can monitor using Zabbix agent on Windows.
- Problem escalations — how to create multi-step alert scenarios (e.g., first send message to the system administrator, then, if a problem is not resolved in 45 minutes, send message to the data center manager).
Install Zabbix Agent on Ubuntu 20.04

Zabbix agent is installed on the remote host (target) to monitor the hard drive, memory processor, etc. The agent collects data and sends back to Zabbix Server.
Zabbix agents can use passive or active checks to pass information. In passive check, Zabbix server (poller) requests an agent for certain information, and the agent sends back a value. In the active check, the agent process all data and pushes it to the Zabbix server. However, agent periodically connects the server to collect metric which needs to be monitored.
We will begin by installing Zabbix agent to the remote Ubuntu 20.04 host and later add a host to Zabbix server dashboard.
Step 1: Enable Zabbix repository on remote host
Begin by updating the package lists on the remote host.
Then download the Zabbix repository Debian file from Zabbix download center as follows.
wget https://repo.zabbix.com/zabbix/5.0/ubuntu/pool/main/z/zabbix-release/zabbix-release_5.0-1+focal_all.debThen enable it using the dpkg command as follows:
sudo dpkg -i zabbix-release_5.0-1+focal_all.debNext, update the package index to ensure the repository is synced
Step 2: Install Zabbix agent
Once the repository is in place, install Zabbix agent.
sudo apt install zabbix-agentOnce the installation is complete, check whether the Zabbix-agent daemon is running as follows:
sudo systemctl status zabbix-agent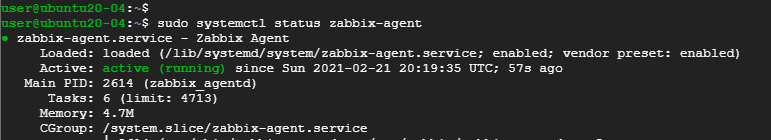
Zabbix-agent listens to port 10050. You might want to confirm this using the netstat command:
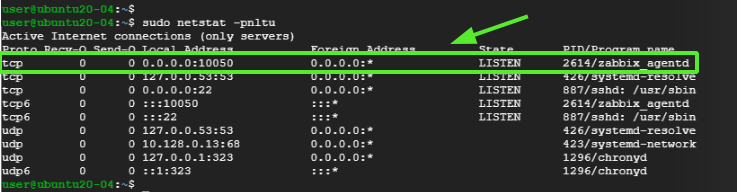
The image above is a confirmation that Zabbix agent service is up and running.
Step 3: Configure Zabbix agent
We are satisfied that the Zabbix agent is running as expected. But that is not enough. We need to make a few changes to the configuration file at /etc/zabbix/zabbix_agentd.conf so that Zabbix agent can communicate with the Zabbix server.
sudo vim /etc/zabbix/zabbix_agentd.confHere we are going to enable passive checks on the agent. First, locate the variable «Server» and «Hostname» in the zabbix_agentd.conf file.
For example, My Zabbix server IP is 10.128.0.16 and the hostname (client system) is ubuntu-20.
Save the changes and exit the file. Then restart Zabbix agent service to the changes to be effected.
sudo systemctl restart zabbix-agentNote if you are configure active check then look for the variable «ServerActive» and uses port 10051.
Step 4: Configure the firewall
The final step in configuring the host is allowing the port that Zabbix agent listens to across the firewall. If you have UFW firewall enables, execute the commands:
And verify that the port has been opened or allowed on the firewall.
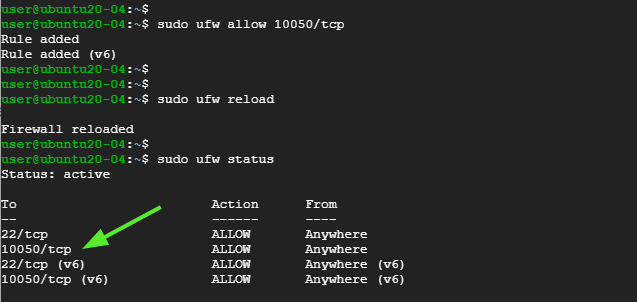
Perfect! The zabbix-agent should now be in a position to communicate with the server.
Step 5: Add host on Zabbix server
By default, Zabbix only monitors the server on which it is installed. In this section, we will be adding the Zabbix host on the Zabbix server on the browser.
So, login in to your instance of Zabbix Server on the browser.
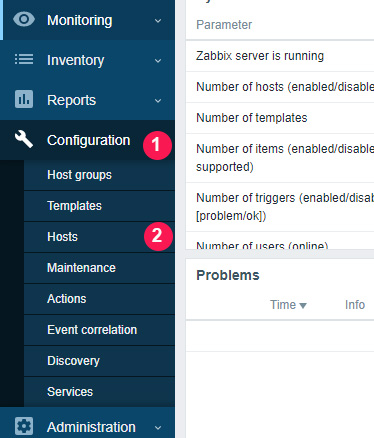
On the left navigation pane, Click on Configuration > Hosts
Navigate to the top-right corner and click on ‘Create host‘
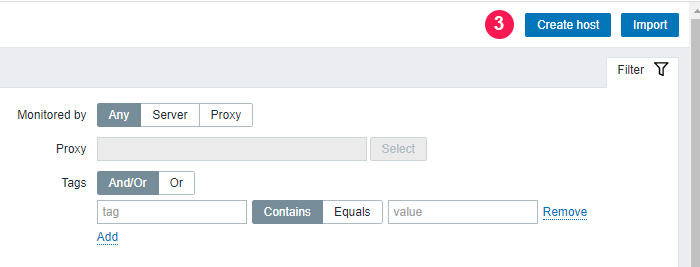
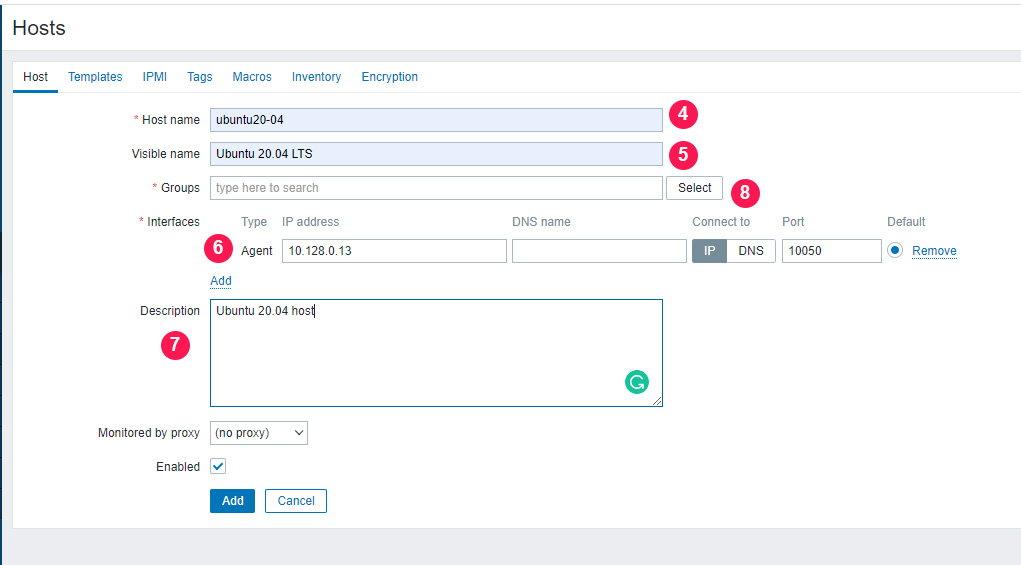
On the window that appears, fill out the remote host details such as hostname. visible name, IP address, a brief description and click on the ‘Select‘ button adjacent to the ‘Groups’ text field.
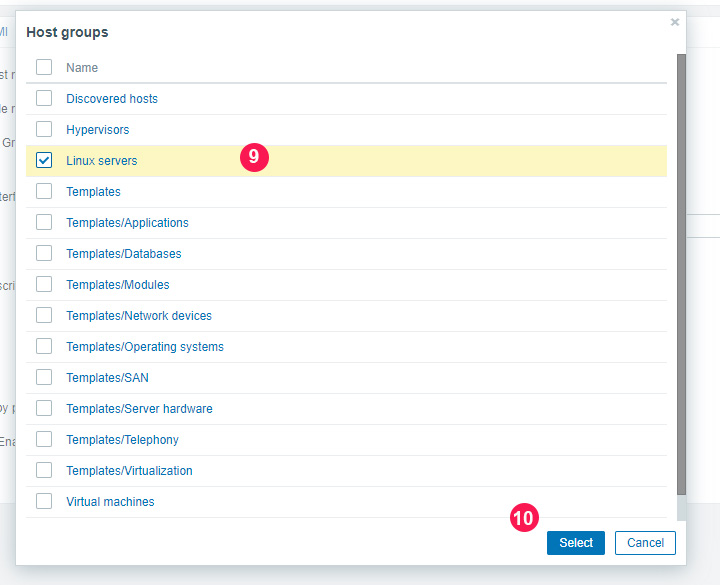
On the list that appears , select ‘Linux servers‘ and click on the ‘Select‘ button.
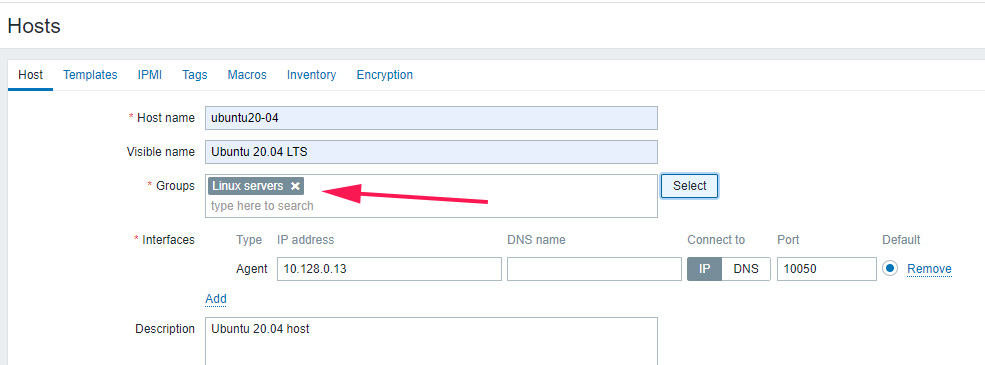
This takes you back and you can view the newly added group as indicated.
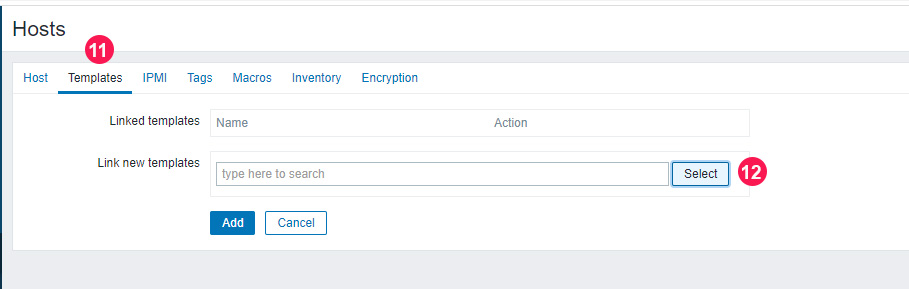
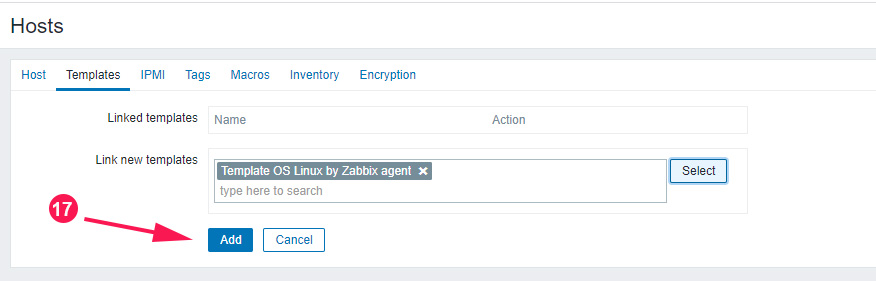
Next, click on the ‘Templates‘ tab and click the ‘Select‘ button adjacent to the ‘Link new Templates‘ text field.
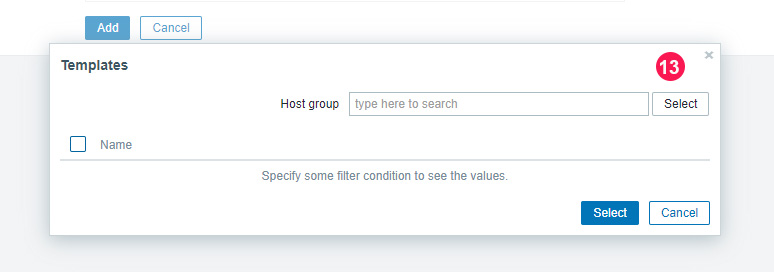
Click on the ‘Select‘ button next to the ‘Host group‘ text field as shown.
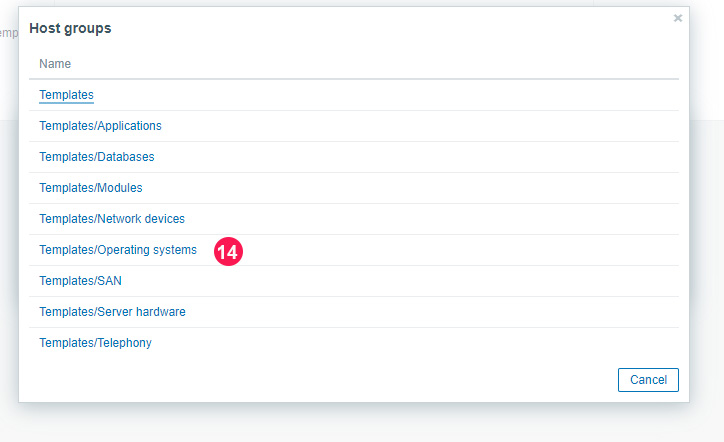
Click on the ‘Templates/Operating systems’ option as shown.
Then select the ‘Template OS Linux by Zabbix agent’ option and click on ‘Select‘.
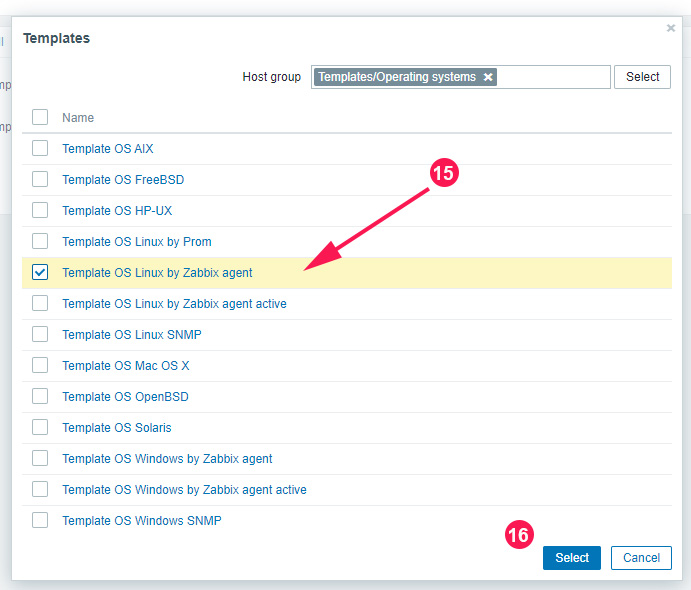
Then finally, click on the ‘Add’ button.
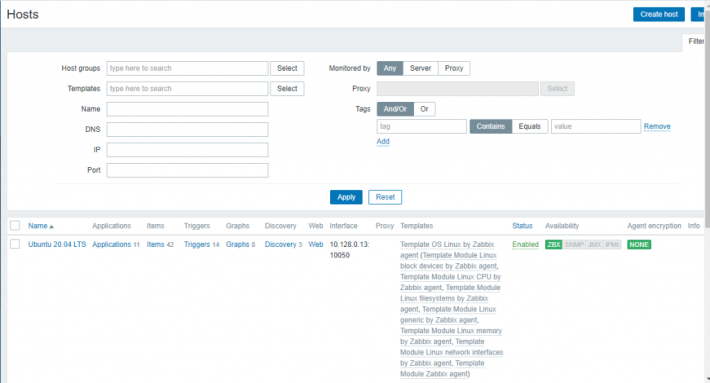
And voila! your host will be listed on the dashboard as shown.
Conclusion
In this tutorial, we learn how to install the Zabbix agent on Ubuntu 20.04 system and configure it to communicate with the Zabbix server. This helps to actively monitor target local resources and applications.
If this resource helped you, let us know your care by a Thanks Tweet. Tweet a thanks